

International trade continued to expand in 2025, driven by rising demand for advanced technology, energy resources, automobiles, pharmaceutical products, and industrial machinery. Countries worldwide increasingly relied on cross-border supply chains to source essential raw materials, manufactured goods, & high-value technology products. According to global trade data, worldwide exports reached around $25.6 trillion in 2025, increasing by around 7% compared with $23.93 trillion in 2024. The expansion highlighted the importance of international trade in supporting economic growth, industrial development, and global supply chain connectivity.
From semiconductor chips and smartphones to crude oil, gold, cars, and petroleum products, global merchandise trade reflected significant changes in production, consumption, and international sourcing patterns. The composition of international trade also changed considerably. Electronic integrated circuits emerged as the world's largest exported product, surpassing automobiles and crude oil. Gold recorded particularly strong growth in international trade value, while computers, smartphones, and semiconductor-related products benefited from increasing investment in artificial intelligence (AI), data centres, and digital infrastructure.
Global imports followed a similar pattern, with integrated circuits, crude oil, automobiles, gold, petroleum products, computers, and smartphones accounting for substantial import expenditure. The momentum continued into 2026, according to global trade statistics. The value of global merchandise trade increased by 15% year-on-year during the first half of 2026. This article examines the world's top exports and imports in 2025-26, including the top 10 internationally traded products, their estimated trade values, annual growth rates, and the major factors influencing global import-export activity.
Global Trade Overview 2025-26: Key Statistics
International trade is an essential component of the global economy, connecting manufacturers, exporters, importers, wholesalers, retailers, and consumers across different countries. In 2025, the value of worldwide merchandise exports reached around $25.6 trillion, compared with $23.93 trillion in 2024, according to the World Trade Organization (WTO). This represented an annual increase of around 7%. The expansion reflected higher trade values across several important product categories, particularly electronic components, gold, computers, pharmaceuticals, and telecommunications equipment.
Key global trade statistics for 2025:
Global merchandise exports: around $25.6trillion.
Global merchandise trade (2026 H1): $13.7 trillion.
Annual export growth: around 7%.
Top exported product: Electronic integrated circuits and microassemblies.
Top imported product: Electronic integrated circuits and microassemblies.
Fast-growing export category: Computer parts and accessories.
Fast-growing import category: Computer parts and accessories.
Largest exporter: China ($3.8 trillion)
Largest importer: USA ($3.5 trillion)
Major international trade drivers: Semiconductors, energy products, automobiles, pharmaceuticals, and precious metals.
The top 20 globally exported products generated around 40.2% of total international export sales in 2025. Similarly, the top 20 imported products represented more than 41.5% of global import expenditure, according to the UNCTAD Global Trade Update. These figures demonstrate how international trade is concentrated in several high-value product categories that support manufacturing, technology, transportation, healthcare, and energy industries.
Top 10 Export Products in the World: Largest Exports
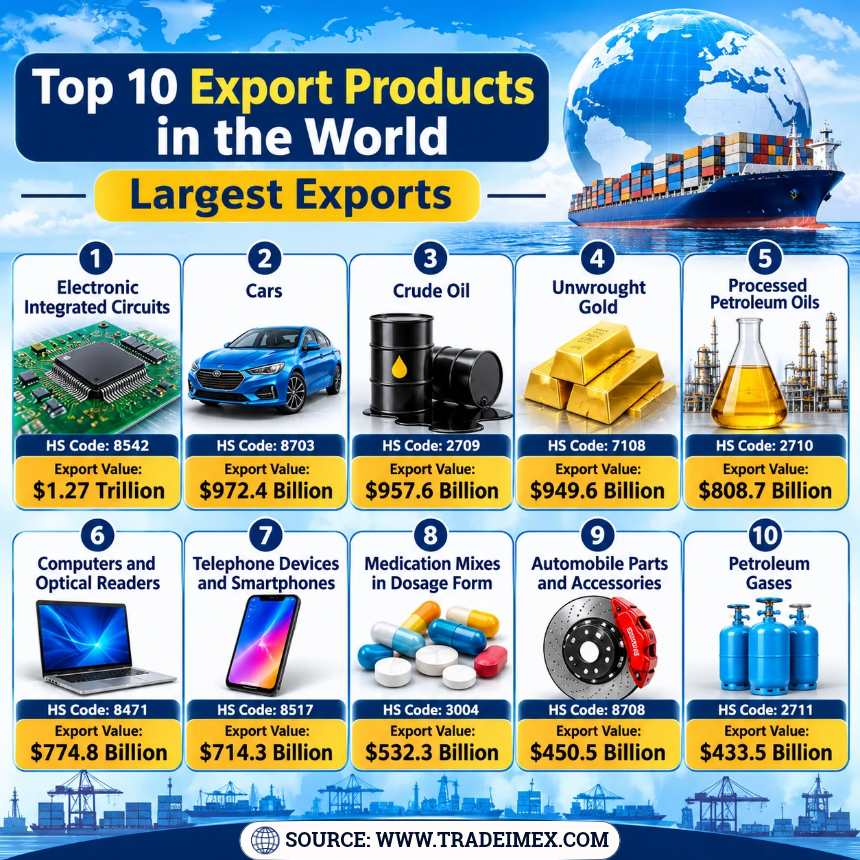
Global export data for 2025 demonstrate the growing importance of technology products alongside traditional commodities such as crude oil, gold, automobiles, and refined petroleum. The following ranking is based on individual internationally traded product categories at the four-digit Harmonized Tariff System (HTS) level in 2025-26:
1. Electronic Integrated Circuits and Microassemblies
HS Code: 8542 | Export Value: $1.27 Trillion | Growth: 20.9%
Electronic integrated circuits and microassemblies ranked first among the world's exported products in 2025.
Global exports reached around $1.27 trillion, increasing by 20.9% compared with 2024, as per the electronics & semiconductor industry trade data.
These products are essential components of modern electronic devices, including smartphones, computers, servers, telecommunications equipment, automotive electronics, and industrial machinery.
The rapid development of artificial intelligence, cloud computing, semiconductor manufacturing, and advanced electronic systems has contributed to increasing international demand.
Major semiconductor-exporting economies include Taiwan, China, South Korea, Singapore, Japan, and the United States.
The semiconductor industry has become a strategically important component of global trade because of its role in global manufacturing & digital infrastructure.
2. Cars
HS Code: 8703 | Export Value: $972.4 Billion | Growth: 1.1%
Passenger vehicles remained the second-largest exported product worldwide in 2025. Global car exports reached around $972.4 billion, increasing by 1.1% year-on-year.
International automobile trade includes petrol-powered cars, diesel vehicles, hybrid vehicles, and electric passenger cars.
Germany, Japan, China, South Korea, Mexico, and the United States are among the major automobile-exporting economies.
The international automotive industry is undergoing a significant transformation as electric vehicles, battery technology, connected vehicles, and advanced driver-assistance systems become increasingly important.
3. Crude Oil
HS Code: 2709 | Export Value: $957.6 Billion | Growth: -8.1%
Crude oil ranked third among the world's largest exported products in 2025, with international export sales reaching around $957.6 billion.
However, exports declined by 8.1% compared with 2024, reflecting changes in international oil prices, production levels, and global energy market conditions.
Crude oil remains an essential commodity for petroleum refining, transportation fuels, petrochemicals, plastics, and industrial energy requirements.
Saudi Arabia, the United States, Russia, Canada, Iraq, and the United Arab Emirates are important participants in international crude oil trade.
4. Unwrought Gold
HS Code: 7108 | Export Value: $949.6 Billion | Growth: 48.6%
Unwrought gold recorded one of the strongest increases among the world's leading export products in 2025. Global export value reached around $949.6 billion, representing growth of 48.6% compared with 2024.
The increase reflected higher international gold prices and strong investment demand for precious metals.
Gold is widely traded for jewellery manufacturing, investment, central bank reserves, electronics, and industrial applications.
Switzerland, the United Kingdom, Hong Kong, Australia, Canada, and the United Arab Emirates are important centres in international gold trading and distribution.
5. Processed Petroleum Oils
HS Code: 2710 | Export Value: $808.7 Billion | Growth: -9.8%
Processed petroleum oils ranked fifth among the world's leading export commodities in 2025, with exports valued at around $808.7 billion.
The category includes refined petroleum products such as diesel, gasoline, aviation fuel, lubricants, and other petroleum-based preparations.
Despite its substantial international trade value, exports declined by 9.8% compared with 2024.
The decline reflected changes in global refining margins, energy prices, demand patterns, and petroleum product trade flows.
Major exporters include the United States, the Netherlands, Singapore, South Korea, India, and the United Arab Emirates.
6. Computers and Optical Readers
HS Code: 8471 | Export Value: $774.8 Billion | Growth: 47.6%
Computers and optical readers generated around $774.8 billion in global export sales during 2025, increasing by 47.6% compared with 2024.
The category includes laptops, desktops, data-processing machines, servers, and other computer systems.
Growing investments in artificial intelligence, cloud computing, enterprise digitalization, and data-centre infrastructure contributed to rising demand.
China, Taiwan, Mexico, the United States, and several Asian manufacturing economies play important roles in international computer exports.
7. Telephone Devices and Smartphones
HS Code: 8517 | Export Value: $714.3 Billion | Growth: 18.2%
Telephone devices, including smartphones, ranked seventh among the world's leading exported products in 2025.
Global export value reached around $714.3 billion, representing annual growth of 18.2%.
The category includes smartphones, communication equipment, telephone network devices, and related telecommunications products.
China, Vietnam, India, South Korea, and other Asian manufacturing economies are important suppliers of telecommunications equipment to international markets.
The growth of 5G networks, digital services, mobile computing, and connected devices continues to support international demand.
8. Medication Mixes in Dosage Form
HS Code: 3004 | Export Value: $532.3 Billion | Growth: 11.8%
Pharmaceutical preparations in measured doses generated around $532.3 billion in global exports in 2025, increasing by 11.8% year-on-year.
These products include packaged medicines, tablets, capsules, injectable preparations, and other pharmaceutical formulations.
The pharmaceutical trade market is supported by healthcare expenditure, ageing populations, increasing demand for chronic disease treatments, and the expansion of international medicine distribution networks.
Germany, Switzerland, Ireland, the United States, Belgium, and other European pharmaceutical manufacturing centres are important exporters.
9. Automobile Parts and Accessories
HS Code: 8708 | Export Value: $450.5 Billion | Growth: -0.4%
Automobile parts and accessories ranked ninth among the world's largest export products in 2025, with international export sales of around $450.5 billion.
The category includes engines, transmissions, braking systems, steering components, suspension systems, and other automotive parts.
International automotive supply chains depend heavily on cross-border exports of components between manufacturing centres and vehicle assembly facilities.
Germany, China, Japan, Mexico, South Korea, and the United States are important suppliers of automobile components.
10. Petroleum Gases
HS Code: 2711 | Export Value: $433.5 Billion | Growth: -0.3%
Petroleum gases completed the world's top 10 export products in 2025, generating around $433.5 billion in international export sales.
The category includes liquefied petroleum gases and other gaseous hydrocarbons used for heating, electricity generation, transportation, and industrial applications.
The international petroleum gas market is influenced by energy security needs, LNG infrastructure, seasonal demand, and changes in natural gas production.
The United States, Qatar, Australia, Russia, and Norway are among the important participants in global gas exports.
Top 10 Import Products in the World: Leading Imports
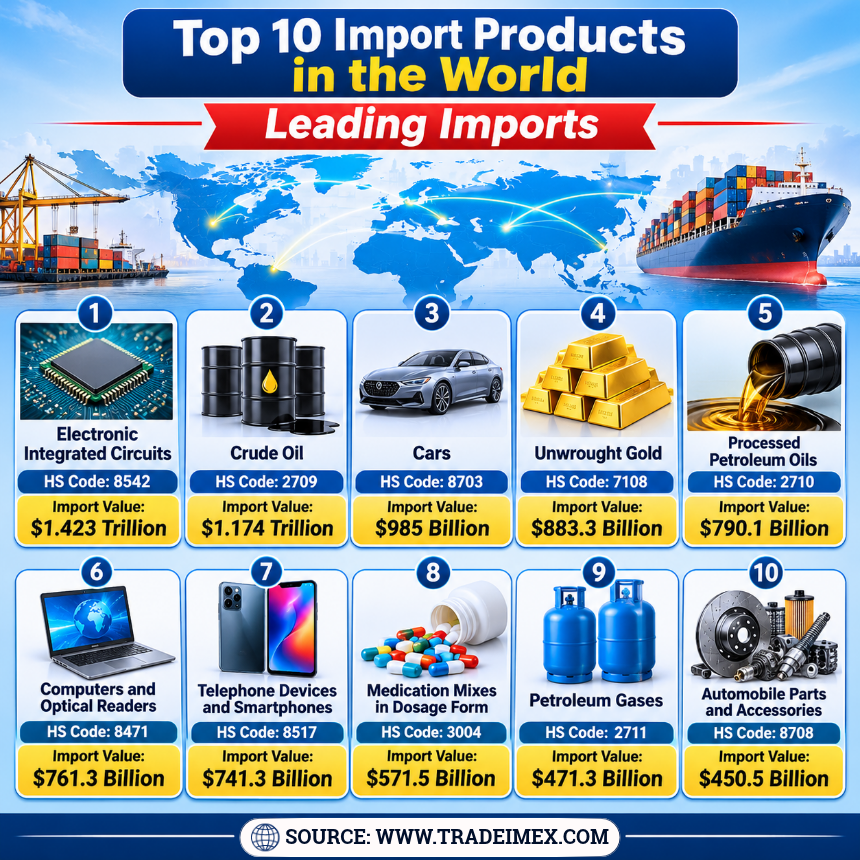
Global import data provide an understanding of the products purchased by countries to meet domestic consumption, industrial production, energy needs, & infrastructure needs. In 2025, electronic integrated circuits, crude oil, automobiles, gold, refined petroleum products, computers, and smartphones accounted for the largest individual product import values. The following are the world's top 10 imported products by value in 2025-26:
1. Electronic Integrated Circuits and Microassemblies
HS Code: 8542 | Import Value: $1.423 Trillion | Growth: 17.1%
Electronic integrated circuits and microassemblies ranked first among global imports in 2025, with global import expenditure reaching around $1.42 trillion.
These goods are crucial for semiconductor manufacturing, consumer electronics, telecommunications, automotive production, & artificial intelligence infrastructure.
Major importing economies include China, Hong Kong, Singapore, Taiwan, South Korea, and the United States.
The growing demand for advanced processors, memory chips, & semiconductor components has strengthened the importance of integrated circuits in global supply chains.
2. Crude Oil
HS Code: 2709 | Import Value: $1.174 Trillion | Growth: -12.9%
Crude oil was the second-largest imported product worldwide in 2025, with global imports valued at around $1.174 trillion.
Despite its importance in the international energy market, import value declined by 12.9% compared with 2024.
Oil-importing economies depend on international crude supplies to operate refineries and meet domestic requirements for transportation fuels, petrochemicals, and industrial energy.
China, India, the United States, South Korea, Japan, and several European economies are major crude oil importers.
3. Cars
HS Code: 8703 | Import Value: $985 Billion | Growth: -0.6%
Passenger cars ranked third among the world's leading imported products in 2025, with global import expenditure reaching around $985 billion, as per the automotive industry trade data.
International vehicle imports include conventional petrol and diesel cars, hybrid vehicles, and electric passenger vehicles.
The United States, Germany, the United Kingdom, China, France, and Canada are among the major automobile-importing markets.
International demand is influenced by consumer purchasing power, vehicle replacement cycles, automotive technology, and trade policies.
4. Unwrought Gold
HS Code: 7108 | Import Value: $883.3 Billion | Growth: 29.9%
Unwrought gold ranked fourth among the world's largest imported products in 2025, generating around $883.3 billion in international import expenditure.
Imports increased by 29.9% compared with 2024, supported by higher gold prices and investment demand.
Gold is imported for jewellery manufacturing, refining, financial reserves, investment products, and industrial applications.
Switzerland, India, China, the United Kingdom, Hong Kong, and the United States are important gold-importing markets.
5. Processed Petroleum Oils
HS Code: 2710 | Import Value: $790.1 Billion | Growth: -14.5%
Processed petroleum oils ranked fifth among global import products in 2025, with imports reaching around $790.1 billion.
This category includes refined fuels such as diesel, gasoline, aviation fuel, and other petroleum preparations.
International imports support transportation networks, industrial production, electricity generation, and domestic fuel consumption.
The United States, Australia, Singapore, the Netherlands, and several European and Asian economies are important petroleum product import markets.
6. Computers and Optical Readers
HS Code: 8471 | Import Value: $761.3 Billion | Growth: 37.7%
Computers and optical readers generated around $761.3 billion in global imports during 2025.
Import value increased by 37.7% compared with the previous year, reflecting strong demand for computing infrastructure and digital technologies.
The category includes servers, laptops, desktops, data-processing machines, and other computing equipment.
The expansion of AI applications, cloud services, enterprise computing, & data-centre development continues to increase global demand for these products.
7. Telephone Devices and Smartphones
HS Code: 8517 | Import Value: $741.3 Billion | Growth: 16.2%
Telephone devices, including smartphones, ranked seventh among the world's largest imported products in 2025.
Global imports reached around $741.3 billion, increasing by 16.2% year-on-year.
Smartphones and telecommunications equipment are essential to consumer electronics markets, mobile communication networks, digital services, and business operations.
The United States, China, Hong Kong, Japan, Germany, and India are among the important importing markets.
8. Medication Mixes in Dosage Form
HS Code: 3004 | Import Value: $571.5 Billion | Growth: 11%
Pharmaceutical preparations in dosage form generated around $571.5 billion in global imports in 2025.
Imports increased by 11% compared with 2024, reflecting the importance of international pharmaceutical supply chains.
The category includes packaged medicines, tablets, capsules, and other finished pharmaceutical products.
The United States, Germany, Switzerland, Belgium, Japan, and the United Kingdom are important pharmaceutical importing markets.
9. Petroleum Gases
HS Code: 2711 | Import Value: $471.3 Billion | Growth: 1%
Petroleum gases ranked ninth among global import products in 2025, with international imports valued at around $471.3 billion.
These products are used for residential heating, electricity generation, industrial processes, and transportation.
Natural gas and liquefied petroleum gas imports are particularly important for countries with limited domestic energy production.
China, Japan, South Korea, India, and several European countries are major participants in international gas imports.
10. Automobile Parts and Accessories
HS Code: 8708 | Import Value: $450.5 Billion | Growth: 0.5%
Automobile parts and accessories completed the world's top 10 imported products in 2025, with global import expenditure of around $450.5 billion.
These products include engines, transmissions, braking components, vehicle electronics, and other automotive parts.
The global automotive manufacturing industry depends on international component sourcing, with vehicle manufacturers importing parts from specialized suppliers across multiple countries.
The United States, Germany, Mexico, China, Canada, and other major automotive markets are important importers.
World's Top Exports and Imports: Product Comparison 2025
The international trade rankings highlight the importance of technology, energy, transportation, precious metals, and pharmaceuticals. The following comparison summarizes the top 10 export and import products in 2025.
Rank | Top Exports | Export Value | Top Imports | Import Value |
1 | Integrated circuits | $1.27T | Integrated circuits | $1.423T |
2 | Cars | $972.4B | Crude oil | $1.174T |
3 | Crude oil | $957.6B | Cars | $985B |
4 | Unwrought gold | $949.6B | Unwrought gold | $883.3B |
5 | Petroleum oils | $808.7B | Petroleum oils | $790.1B |
6 | Computers | $774.8B | Computers | $761.3B |
7 | Telephone devices | $714.3B | Telephone devices | $741.3B |
8 | Pharmaceuticals | $532.3B | Pharmaceuticals | $571.5B |
9 | Automobile parts | $450.5B | Petroleum gases | $471.3B |
10 | Petroleum gases | $433.5B | Automobile parts | $450.5B |
The comparison reveals that the same major product categories dominate both sides of international trade. This reflects the interconnected nature of global supply chains, where major manufacturing economies export finished goods and intermediate components while other economies import them to meet domestic production and consumption requirements.
Historical Global Trade Data: Last 10 Years Trade Performance
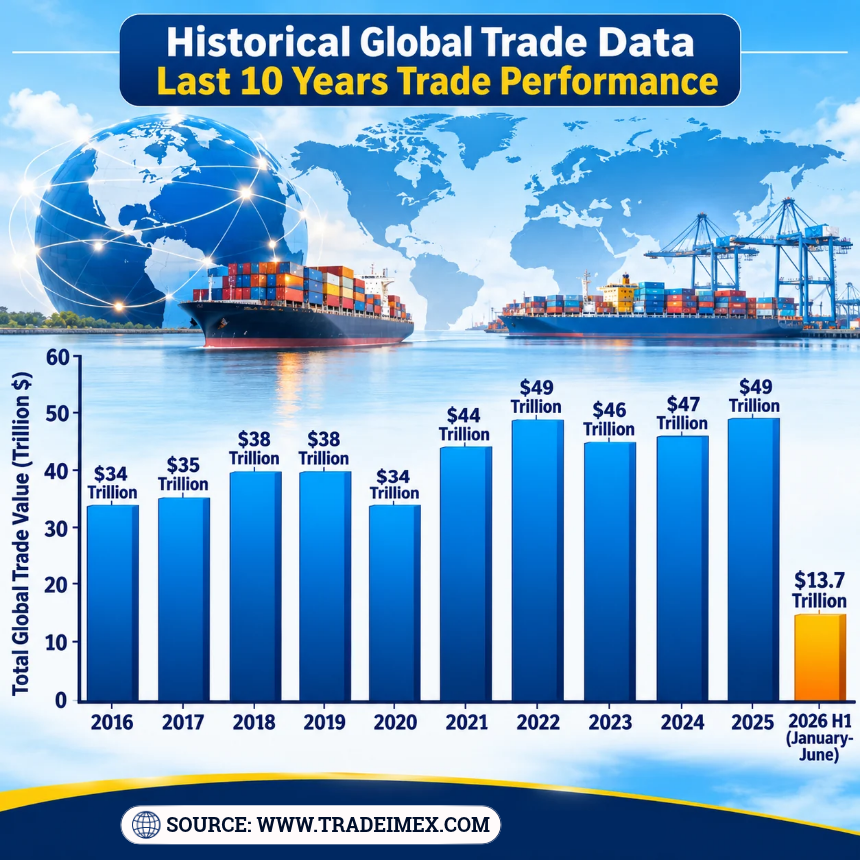
Year of Trade | Total Global Trade Value ($) |
2016 | $34 trillion |
2017 | $35 trillion |
2018 | $38 trillion |
2019 | $38 trillion |
2020 | $34 trillion |
2021 | $44 trillion |
2022 | $49 trillion |
2023 | $46 trillion |
2024 | $47 trillion |
2025 | $49 trillion |
2026 H1 (January-June) | $13.7 trillion |
Global Trade Trends in 2026: What Is Driving Imports and Exports?
The international trade environment continued to evolve in 2026, with technology investment, energy market changes, and geopolitical developments influencing cross-border commerce. According to the WTO's October 2026 Global Trade Outlook, global merchandise trade value increased by 15% year-on-year during January–June 2026. Several product categories recorded particularly strong growth.
1. AI and Semiconductor Trade Expansion
Artificial intelligence has become a major driver of international trade. Semiconductors, servers, computers, and electronic components are increasingly required for AI infrastructure and data-centre development. According to the WTO, AI-enabling goods accounted for 47% of global merchandise trade growth during the first half of 2026. Trade in these products increased by 67% year-on-year.
2. Stronger Demand for Office and Telecommunications Equipment
Global trade in office and telecommunications equipment increased by 49% during the first half of 2026. Electronic components recorded growth of 51%. This development highlights the growing importance of semiconductors, telecommunications equipment, computer hardware, and advanced electronic devices.
3. Energy Market Volatility
Global trade in fuels and mining products recovered in value terms during 2026. The WTO reported a 19% increase in fuels and mining trade value during the first half of the year. Higher energy prices and disruptions to international supply routes contributed to the increase.
4. Continued Growth in Machinery and Automotive Trade
Other machinery recorded around 10% growth during the first half of 2026, while automotive product trade increased by around 5%. Demand for industrial equipment, power-generation machinery, transportation products, and manufacturing technologies continues to support international trade.
5. Pharmaceutical and Healthcare Supply Chains
Pharmaceutical products remain among the most important internationally traded manufactured goods. Healthcare expenditure, medicine accessibility, biotechnology developments, and international distribution networks continue to influence global pharmaceutical imports and exports.
Major Factors Influencing Global Import and Export Markets
Several economic, technological, and geopolitical factors determine the performance of international trade.
1. Global Economic Growth: Economic expansion increases the demand for manufactured products, energy, machinery, transportation equipment, and consumer goods. Slower economic growth can reduce import expenditure and international export earnings.
2. Technological Advancements: Artificial intelligence, semiconductor development, automation, cloud computing, and digital infrastructure are transforming international product demand.
3. Energy Prices: Changes in crude oil, natural gas, and refined petroleum prices directly influence the value of global energy exports and imports.
4. International Trade Policies: Tariffs, trade agreements, customs regulations, and import restrictions influence market access, sourcing decisions, and international supply chains.
5. Geopolitical Developments: Wars, sanctions, shipping disruptions, and regional conflicts can change traditional trade routes and increase transportation and sourcing costs.
6. Supply Chain Diversification: Companies increasingly explore alternative sourcing destinations to reduce dependence on individual suppliers and improve supply chain resilience.
Future Outlook for Global Imports and Exports
The outlook for international trade in 2026 remains closely connected to technology investment, energy demand, global manufacturing, and geopolitical conditions. According to the WTO's October 2026 forecast, global merchandise trade volume is expected to grow by 3.9% in 2026 and 4.1% in 2027. Technology-related products are likely to remain important growth drivers. Semiconductor chips, computers, servers, telecommunications equipment, and electrical components are expected to benefit from continued investment in AI and digital infrastructure.
Energy commodities will also remain central to international trade, although their values will continue to fluctuate with global prices, production, and geopolitical developments. Automobiles, pharmaceutical products, machinery, and precious metals are expected to remain important components of international import-export activity. For exporters and importers, identifying the fastest-growing product categories & understanding global sourcing patterns will be essential to developing competitive global trade strategies.
Conclusion
The world's top exports and imports in 2025-26 demonstrate how international commerce is being shaped by technology, energy, transportation, healthcare, and precious metals. In 2025, electronic integrated circuits ranked first among global exports, generating around $1.27 trillion, while integrated circuits also led worldwide imports at around $1.42 trillion. Cars, crude oil, gold, refined petroleum products, computers, smartphones, & pharmaceutical preparations remained among the most valuable internationally traded commodities.
China continues to be the largest exporter of goods, according to China export data, while the US remains the largest importer, according to US import data. The first half of 2026 brought further momentum, with global merchandise trade value increasing by 15% year-on-year. AI-related products and telecommunications equipment played a particularly important role in this expansion.
Note For Our Readers
Reliable global trade data, HS-code intelligence, shipment records, and country-level import-export statistics can help companies identify leading trading partners, analyze product movements, evaluate sourcing opportunities, and make informed international business decisions. For the latest trade data by country or HS code, AI-powered trade search, or customized trade reports, contact TradeImeX at info@tradeimex.in today.
Frequently Asked Questions
What are the world's top 10 export products in 2025–26?
The world's leading export products include crude petroleum, refined petroleum, cars, integrated circuits, smartphones, computers, gold, natural gas, pharmaceuticals, and broadcasting equipment.
What are the world's most imported products in 2025–26?
Major global imports include crude oil, refined petroleum, automobiles, electronic components, computers, smartphones, pharmaceuticals, gold, natural gas, and machinery.
Which countries are the world's largest exporters?
China, the United States, Germany, the Netherlands, Japan, South Korea, and Italy are among the world's leading merchandise-exporting economies.
Which countries are the world's largest importers?
The United States, China, Germany, the United Kingdom, France, Japan, and the Netherlands are among the major global importing economies.
What was the total value of global trade in 2025–26?
According to trade data, global trade in goods reached around $49 trillion in 2025, marking an 8% increase compared with 2024.
Explore the latest global trade trends, market insights, import-export analysis, and industry updates with TradeImeX blogs.
Request a Data Sample →
Tradeimex
TradeImeX’s content team brings together expertise in global trade data, import-export trends, market intelligence, and international business. Our writers turn complex trade data into clear, actionable insights to help businesses understand markets, identify opportunities, and make informed decisions. From emerging trade trends to country and product-level analysis, we focus on delivering timely insights backed by reliable data.