

The United States is one of the world's largest exporters, supplying energy products, aircraft, pharmaceuticals, machinery, agricultural commodities, technology products, and business services to international markets. Analyzing US export data helps businesses identify leading destination markets, understand demand for American products, and discover opportunities across global supply chains. According to the latest US export data, the total value of US exports reached $2.17 trillion in 2025, a 6% increase from the previous year. The US exported goods worth $1.63 trillion in the first eight months of 2026, as per the US export database.
The USA is the 2nd largest exporter worldwide, according to global trade data. According to US trade data, total US exports of goods and services reached $3.432 trillion in 2025, an increase of $199.8 billion, or 6.2%, compared with 2024. Goods exports accounted for around $2.17 trillion, while services exports reached $1.235 trillion. These figures demonstrate the importance of both physical products and service industries to the American economy.
In 2025-26, understanding the country's export performance requires examining two dimensions: what the United States sells internationally and which countries purchase those products. This guide explores the US main exports, leading destination markets, recent trade trends, and ways to use an export database for market research.
US Export Data at a Glance
Total exports of goods and services in 2025: $3.432 trillion
Goods exports in 2025: $2.178 trillion
Services exports in 2025: $1.235 trillion
Annual growth in goods and services exports: 6.2%
Leading goods export destinations: Mexico and Canada
Major export sectors: Capital goods, energy, industrial supplies, pharmaceuticals, aerospace, agriculture, and services
Understanding US Exports in 2025-26
US exports include physical merchandise shipped to foreign markets and services sold to overseas customers. Goods exports include crude oil, liquefied natural gas, aircraft, computers, industrial machinery, medical products, food commodities, chemicals, & automobiles. Services exports include financial services, travel, intellectual property, consulting, & other business services. The US Bureau of Economic Analysis (BEA) reported that goods exports increased by $117.7 billion in 2025, while services exports grew by $82.1 billion. Growth in both areas contributed to the overall rise in American exports.
Capital goods and industrial supplies were particularly important contributors to merchandise export growth. Higher exports of computers, civilian aircraft, computer accessories, aircraft engines, nonmonetary gold, finished metal shapes, and natural gas supported the performance of several product categories. Pharmaceutical preparations also recorded an increase, while automotive vehicles, parts, and engines experienced a decline.
US Main Exports: What Are the Top US Export Products?
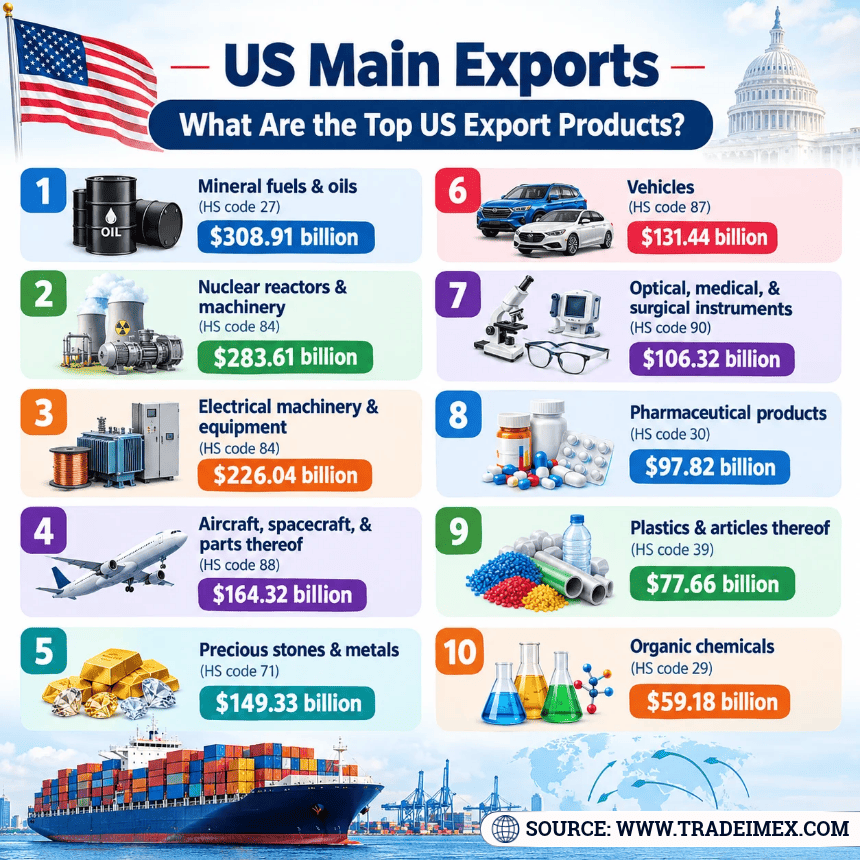
The United States boasts a diverse range of top export products that contribute significantly to its economic success on the global stage. Leading the pack are goods like aircraft and spacecraft, machinery, medical instruments, and electrical machinery. These products, known for their superior quality and cutting-edge technology, have helped establish the US as a key player in international trade. The top 10 main exports of the US, or the leading American export products, as per the US export statistics for 2025, include:
1. Mineral fuels & oils (HS code 27): $308.91 billion (14.18%)
2. Nuclear reactors & machinery (HS code 84): $283.61 billion (13.02%)
3. Electrical machinery & equipment (HS code 84): $226.04 billion (10.38%)
4. Aircraft, spacecraft, & parts thereof (HS code 88): $164.32 billion (7.54%)
5. Precious stones & metals (HS code 71): $149.33 billion (6.85%)
6. Vehicles (HS code 87): $131.44 billion (6.03%)
7. Optical, medical, & surgical instruments (HS code 90): $106.32 billion (4.88%)
8. Pharmaceutical products (HS code 30): $97.82 billion (4.49%)
9. Plastics & articles thereof (HS code 39): $77.66 billion (3.57%)
10. Organic chemicals (HS code 29): $59.18 billion (2.72%)
US Main Exports: Top Products by Value
Major American Export Products by Category
The United States exports a broad range of high-value manufactured goods, commodities, and services, as per the data on US trade in goods with the world. The following categories & selected product groups illustrate the scale and diversity of the country's export economy.
Export category or product group | 2025 value ($) |
Capital goods | $710.3 billion |
Consumer goods | $269.2 billion |
Petroleum exports | $254.3 billion |
Food, feeds, and beverages | $161.0 billion |
Automotive vehicles, parts, and engines | $155.4 billion |
Civilian aircraft, engines, equipment, & parts | $152.8 billion |
Pharmaceutical preparations | $119.8 billion |
Crude oil | $99.7 billion |
Crude oil, petroleum, and natural gas
Energy is central to the American export economy. Crude oil, refined petroleum products, and natural gas connect US producers with overseas refiners, utilities, industrial consumers, and energy traders, as per the US export data under HS code 27.
The 2025 trade report recorded an increase of $19.3 billion in natural gas exports, while crude oil exports declined by $18.8 billion. This difference illustrates why businesses should analyze individual commodities rather than assuming that every energy product follows the same trend. This analysis can be accessed by the AI search on US oil exporters.
Computers, semiconductors, and industrial machinery
Computers, computer accessories, semiconductors, and industrial equipment are important American export categories. These products support industries ranging from data centers and telecommunications to manufacturing, healthcare, and research.
Capital goods exports increased by $63.9 billion in 2025. Computers contributed $16.7 billion to the increase, computer accessories contributed $15.6 billion, and civilian aircraft contributed $15.7 billion. Civilian aircraft engines also recorded a $12.6 billion increase.
Aerospace and aircraft
Aircraft, aircraft engines, equipment, and parts are among the most valuable American export product groups. US aerospace manufacturers supply commercial aircraft, engines, components, and specialized equipment to airlines, maintenance providers, aircraft manufacturers, and governments worldwide.
The sector benefits from advanced engineering capabilities, established manufacturing networks, and international demand for fleet expansion and replacement. Exporters and suppliers can use product-level trade records to investigate destination markets, track shipments, and assess opportunities in aerospace components.
Pharmaceuticals and medical products
Pharmaceutical preparations are another major component of American exports. International demand for prescription medicines, specialty treatments, and other healthcare products supports cross-border trade in this sector, as per the US pharmaceutical export data by HS code 30.
In 2025, the BEA reported a $12.2 billion increase in exports of pharmaceutical preparations. Businesses researching this category should examine the relevant HS codes, destination markets, product classifications, and applicable regulatory requirements before evaluating individual opportunities.
Agricultural products and food commodities
Agriculture remains an important part of US international trade. American producers export products such as soybeans, corn, wheat, meat, dairy products, nuts, and processed foods. Demand varies according to harvest conditions, global prices, livestock feed requirements, and the purchasing needs of individual countries.
Businesses researching agricultural exports should compare annual values, quantities, destination markets, and seasonal shipment patterns. Price movements can cause export values to rise or fall even when physical shipment volumes move differently.
Chemicals, metals, and other industrial supplies
Chemicals, plastics, metal products, and industrial materials serve manufacturers around the world. In 2025, industrial supplies and materials exports increased by $55.8 billion. Nonmonetary gold rose by $49.7 billion, while finished metal shapes increased by $19.6 billion.
These movements show that the category includes products with different market drivers. Precious metals, construction materials, and industrial chemicals each have distinct demand patterns, so detailed commodity classifications are essential for accurate research.
Motor vehicles and automotive components
The United States exports passenger vehicles, trucks, automotive parts, engines, and specialized vehicles. North American supply chains are particularly important because manufacturers and suppliers operate across the US, Canada, and Mexico.
However, automotive exports did not grow uniformly in 2025. Exports of automotive vehicles, parts, and engines declined by $16.8 billion, including a $6.9 billion decrease in passenger cars. This highlights the importance of monitoring specific vehicle categories rather than relying on broad industry assumptions.
US Exports by Country: Where Does the US Export Goods?
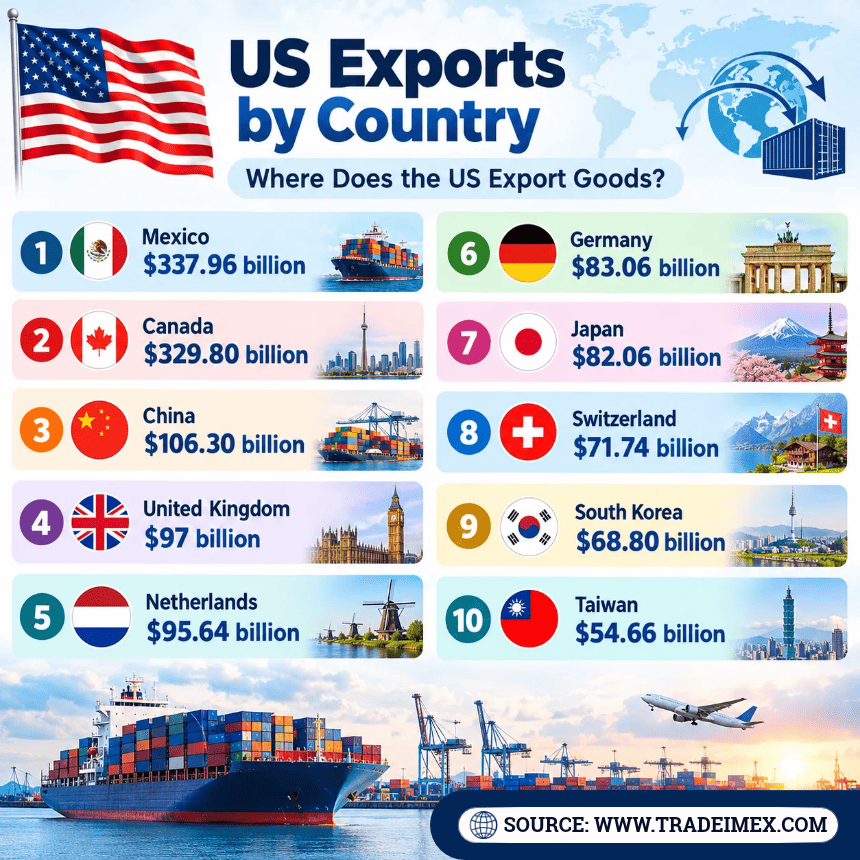
US exports by country play a crucial role in the global economy, highlighting the diverse destinations for American goods. The United States exports a wide range of products to various nations, with significant trade partners including China, Canada, Mexico, & Japan. These exports contribute to strengthening international relationships, promoting economic growth, & enhancing the competitiveness of American businesses on a global scale. The top 10 American export destinations, according to the US shipment data for 2025, include:
1. Mexico: $337.96 billion (15.5%)
2. Canada: $329.80 billion (15.1%)
3. China: $106.30 billion (4.9%)
4. United Kingdom: $97 billion (4.5%)
5. Netherlands: $95.64 billion (4.4%)
6. Germany: $83.06 billion (3.8%)
7. Japan: $82.06 billion (3.8%)
8. Switzerland: $71.74 billion (3.3%)
9. South Korea: $68.80 billion (3.2%)
10. Taiwan: $54.66 billion (2.5%)
1. Mexico
Mexico was the leading destination in this country-level merchandise series, with around $337.96 billion in US goods exports in 2025, as per the data on US exports to Mexico. Cross-border manufacturing, automotive production, electronics, machinery, energy, & agricultural trade support this relation. The United States-Mexico-Canada Agreement (USMCA) is an important framework for regional commerce.
2. Canada
Canada ranked second, with around $329.80 billion in US goods exports. Integrated North American supply chains support trade in machinery, vehicles and parts, energy-related products, agricultural goods, and industrial supplies. Geographic proximity and established commercial relationships make Canada an important market for American companies.
3. China
US goods exports to China were around $106.31 billion in 2025. Agricultural commodities, energy products, industrial materials, machinery, and other manufactured goods feature in bilateral trade. Exporters should also consider tariffs, regulations, geopolitical developments, and changes in purchasing patterns when assessing this market.
4. United Kingdom
The United Kingdom received around $96.80 billion in US goods exports. Aerospace, pharmaceuticals, machinery, medical products, chemicals, and other high-value goods contribute to transatlantic trade. Financial and professional services are also important, although they are not included in this merchandise ranking.
5. Netherlands
US goods exports to the Netherlands reached around $95.64 billion. The country serves as an important European commercial and distribution hub, with trade infrastructure connecting suppliers to customers across the wider European market. Energy, chemicals, machinery, and other industrial products contribute to trade flows.
6. Germany
Germany accounted for around $83 billion in US goods exports. As a major industrial economy, it purchases machinery, aerospace products, chemicals, medical goods, and other specialized products. American suppliers can assess German demand by comparing detailed commodity categories and shipment histories.
7. Japan
US goods exports to Japan were around $82.06 billion. Agricultural products, aircraft and aerospace equipment, pharmaceuticals, machinery, and selected energy products contribute to this trade relationship. Businesses should evaluate Japanese market standards and product requirements alongside export trends.
8. Switzerland
Switzerland received around $71.74 billion in US goods exports in this series. Pharmaceuticals, chemicals, precision equipment, machinery, and other high-value goods are relevant to trade between the two countries. Because trade statistics can be affected by product classification and re-exports, source definitions matter when interpreting individual categories.
9. South Korea
US goods exports to South Korea reached around $68.79 billion. Trade includes industrial equipment, agricultural commodities, energy products, aerospace-related goods, and specialized manufactured products. Manufacturers can use HS-code analysis to identify the products with the strongest demand signals.
10. Taiwan
Taiwan rounded out the top 10, with around $54 billion in US goods exports. Machinery, fuels, chemicals, aircraft, agricultural inputs, and other industrial products form part of the trade relationship. Taiwan’s industrial and agricultural sectors create a range of potential markets for American suppliers.
What does this ranking tell exporters?
Mexico and Canada together represent especially important destinations for US merchandise, reflecting the integration of North American supply chains. Meanwhile, European and Asian markets offer opportunities across high-value manufacturing, energy, technology, and pharmaceuticals. Country rankings are a useful starting point, but product-specific data is necessary to determine which markets are most relevant to a particular business.
US Export Data: Last 10 Years Trade Performance
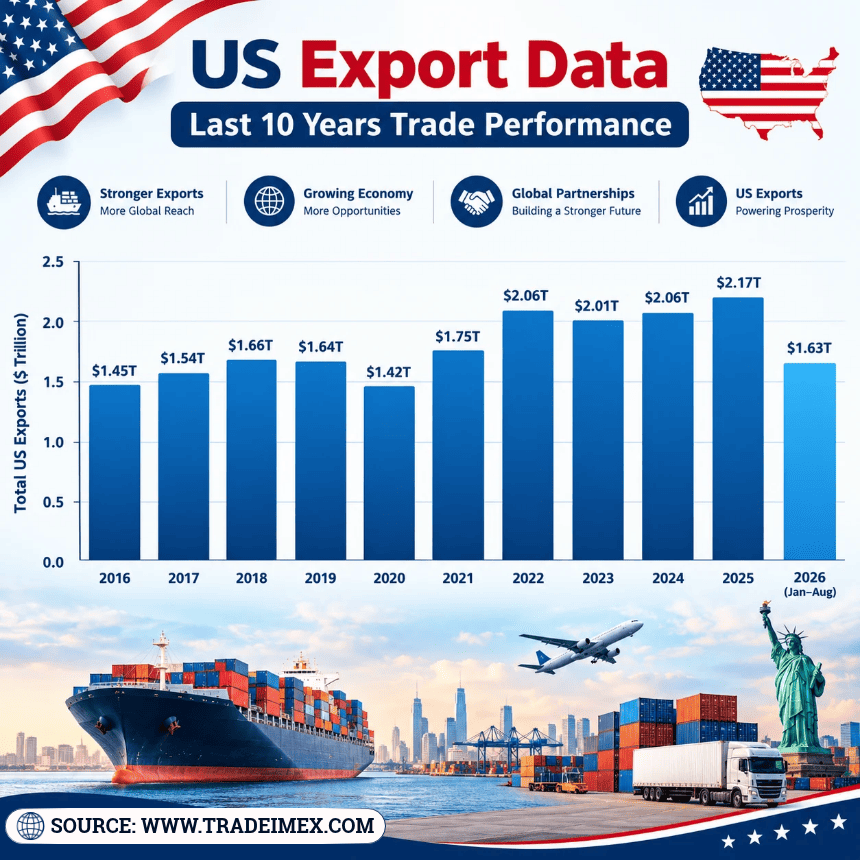
Year of Exports | Total US Exports ($) |
2016 | $1.45 trillion |
2017 | $1.54 trillion |
2018 | $1.66 trillion |
2019 | $1.64 trillion |
2020 | $1.42 trillion |
2021 | $1.75 trillion |
2022 | $2.06 trillion |
2023 | $2.01 trillion |
2024 | $2.06 trillion |
2025 | $2.17 trillion |
2026 (January-August) | $1.63 trillion |
US Export Trends in 2025-26
Growth across goods and services: US exports of goods and services rose by $199.8 billion, or 6.2%, in 2025, reaching $3.432 trillion.
Capital goods strength: Capital goods exports increased by $63.9 billion, supported by computers, aircraft, computer accessories, & aircraft engines.
Industrial materials & energy: Industrial supplies & materials exports increased by $55.8 billion. Natural gas & nonmonetary gold were among the products contributing to growth, while crude oil moved in the opposite direction.
Growth in selected services: Services exports increased by $82.1 billion. Other business services, intellectual property charges, & financial services contributed to the increase.
Uneven sector performance: Automotive vehicles, parts, and engines recorded a decline, demonstrating that export trends vary significantly by industry.
The 2025 results show that US export performance was supported by multiple sectors rather than a single product group. Technology-related capital goods, industrial materials, pharmaceuticals, and services all contributed to the overall picture.
Monthly US Exports in 2026: Latest Trade Statistics
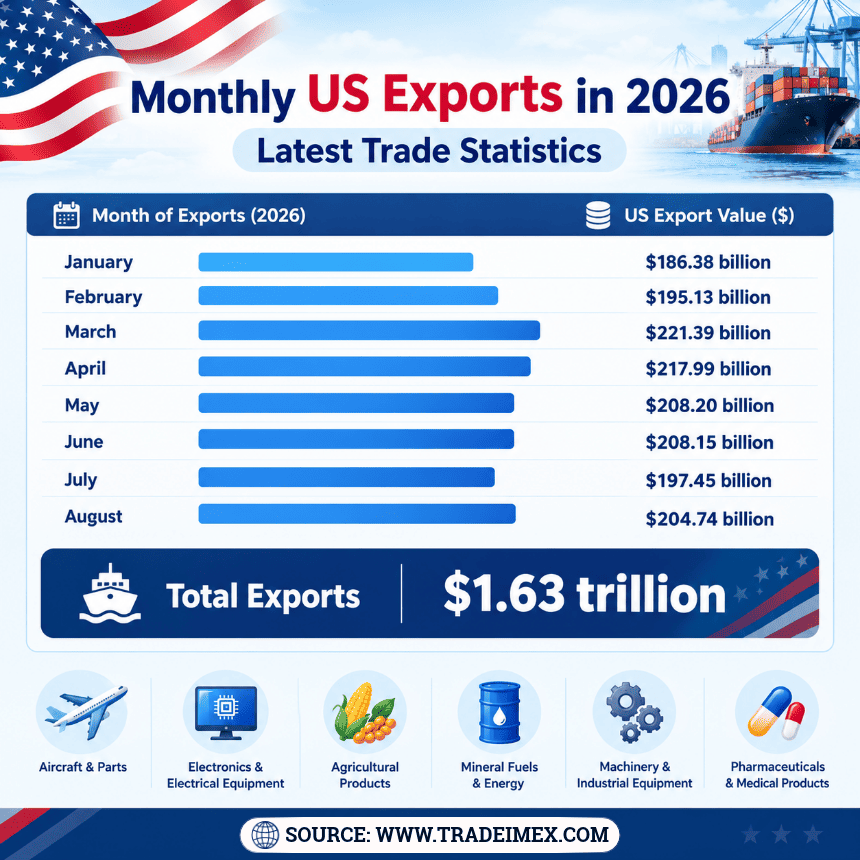
Month of Exports (2026) | US Export Value ($) |
January | $186.38 billion |
February | $195.13 billion |
March | $221.39 billion |
April | $217.99 billion |
May | $208.20 billion |
June | $208.15 billion |
July | $197.45 billion |
August | $204.74 billion |
Total Exports | $1.63 trillion |
How TradeImeX Supports US Export Research
TradeImeX is an AI-powered global import-export data and trade-intelligence platform designed to help users explore international markets and trade activity. Its capabilities include product and HS-code research, country-level analysis, shipment data where available, buyer-supplier discovery, historical trade research, & customized reporting.
For businesses evaluating US export products, the value of a trade-intelligence platform lies in connecting a broad market question to more specific research. For example, a company investigating American pharmaceutical exports may want to identify relevant HS codes, compare destination markets, and review available shipment records. An agricultural exporter may want to assess destination-country demand and track changes over several years.
TradeImeX can help users structure this research through its search and data-analysis features. Users should select the appropriate dataset and confirm that the required country, product, company, and shipment fields are available for their intended analysis. Rather than relying solely on a general list of the top US exports by value, businesses can combine national trade statistics with more detailed product and market research. This approach can make it easier to evaluate potential markets, compare opportunities, and develop evidence-based export strategies.
Conclusion and Final Thoughts
So, what are the main exports of the US? The answer, as per the US export data, includes capital goods, aircraft and aerospace equipment, pharmaceuticals, petroleum and natural gas, computers, industrial machinery, agricultural products, chemicals, metals, automotive products, & a substantial range of services. In 2025, US exports of goods & services reached $3.432 trillion, with goods exports totaling $2.198 trillion and services exports reaching $1.235 trillion.
Mexico and Canada remained the leading destinations in the cited country-level merchandise series, while China, the United Kingdom, the Netherlands, Germany, Japan, Switzerland, South Korea, & Brazil also ranked among the top markets. The top 10 exports of USA can vary depending on whether products are grouped by end-use category, industry, or individual HS code. Likewise, the ranking of US exports by country depends on the statistical source & whether analysis covers merchandise alone or goods and services combined.
Note For Our Readers
For exporters, manufacturers, researchers, and international sales teams, the next step is to move beyond national totals and investigate the products and destinations relevant to their business. Using official trade statistics alongside a suitable trade-intelligence platform can support more informed decisions in the global marketplace. For the latest US import-export data, AI-powered US trade search, US export records by country or HS code, or customized trade reports, contact info@tradeimex.in to get US market insights & trade data for your business.
Explore the latest global trade trends, market insights, import-export analysis, and industry updates with TradeImeX blogs.
Request a Data Sample →
Tradeimex
TradeImeX’s content team brings together expertise in global trade data, import-export trends, market intelligence, and international business. Our writers turn complex trade data into clear, actionable insights to help businesses understand markets, identify opportunities, and make informed decisions. From emerging trade trends to country and product-level analysis, we focus on delivering timely insights backed by reliable data.