
The announcement that the India-New ZealandFTA has been finalized marks a significant milestone in economic cooperation between the two countries. The proposed India-New Zealand free trade agreement is expected to strengthen trade, investment, services, supply chains, and business partnerships while opening new opportunities for exporters and importers on both sides. Recent trade statistics show that India-New Zealand bilateral relations continue to deepen through expanding merchandise trade. In 2025, New Zealand imported goods worth $879.39 million from India while exporting $438.98 million to India, according to the New Zealand export data. Total bilateral merchandise trade reached around $1.32 billion, highlighting the growing economic importance of the relationship and impacting global trade data.
As the India-New Zealand trade deal moves toward implementation, businesses are closely monitoring sectors that could benefit from lower tariffs, improved market access, streamlined customs procedures, and stronger commercial cooperation.
New Zealand-India Bilateral Trade (2023-2025)
Year | Bilateral Trade Value |
2023 | $953.31 million |
2024 | $1.12 billion |
2025 | $1.31 billion |
Trade between the two countries has shown consistent growth over the last three years. New Zealand's imports from India increased from $690.95 million in 2023 to $879.39 million in 2025, representing an increase of more than $188 million. Meanwhile, New Zealand exports to India rose from $262.36 million to $438.98 million during the same period.
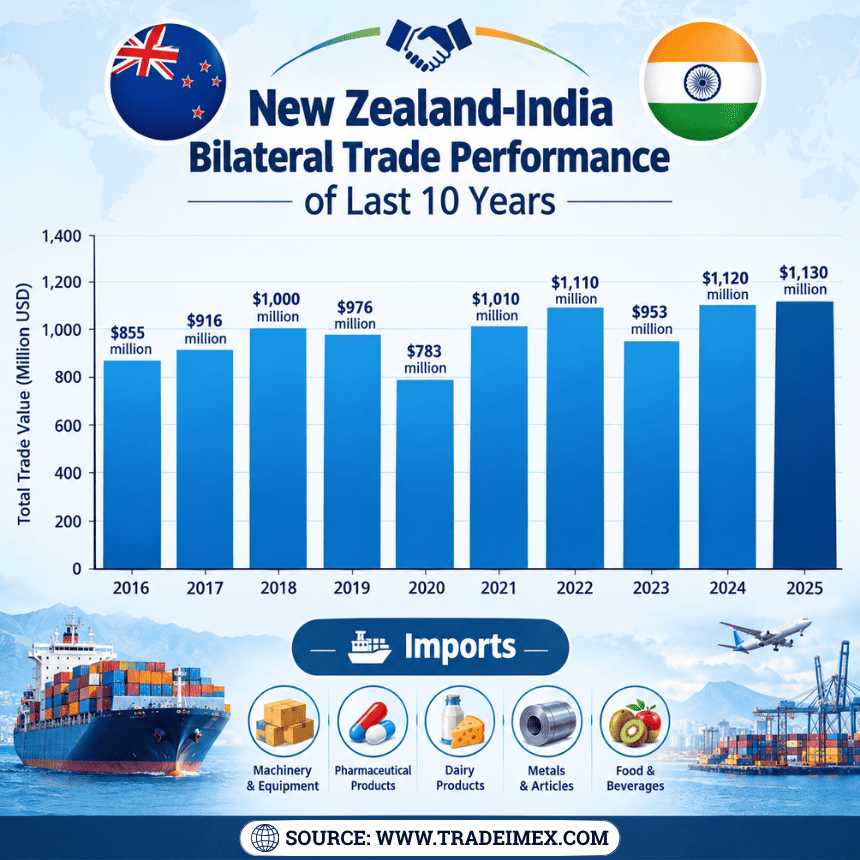
New Zealand-India Bilateral Trade Performance of Last 10 Years
Year | Total Trade Value |
2016 | $855 million |
2017 | $916 million |
2018 | $1.00 billion |
2019 | $976 million |
2020 | $783 million |
2021 | $1.01 billion |
2022 | $1.11 billion |
2023 | $953 million |
2024 | $1.12 billion |
2025 | $1.13 billion |
The total trade value shows a strong long-term growth trend, rising from $855 million in 2016 to $1.13 billion in 2025. Trade surpassed the $1 billion mark in 2018 and maintained overall upward momentum despite temporary declines in 2019, 2020, and 2023. The sharp drop to $783 million in 2020 was followed by a strong recovery, with trade exceeding $1 billion in multiple years. Record trade values in 2024 ($1.12 billion) and 2025 ($1.13 billion) reflect expanding commercial ties, stronger market demand, and increasing opportunities for future trade growth.
The data demonstrates that India is becoming an increasingly important market for New Zealand exporters, while New Zealand continues to source a wide range of manufactured & industrial products from India. The growth trend also provides a strong foundation for the India-New Zealand FTA 2026, which aims to accelerate bilateral trade further and well & truly impact the Asia trade data and Oceania trade data as well.
New Zealand-India Bilateral Trade Data
The latest New Zealand-India bilateral trade data highlights the growing commercial partnership between the two countries in 2025.
Total Bilateral Trade (2025):$1.32 billion
New Zealand Imports from India (2025):$879.39 million
New Zealand Exports to India (2025):$438.98 million
Trade Growth (2024-2025): Bilateral trade increased from $1.12 billion to $1.32 billion
Leading New Zealand Exports to India: Edible fruits and nuts, aluminum, wood products, wool, and industrial materials.
Major Indian Exports to New Zealand: Pharmaceuticals, machinery, electrical equipment, textiles, mineral fuels, and engineering products.
These figures demonstrate the strengthening of India-New Zealand bilateral relations and the increasing importance of both markets to each other. The steady rise in India exports to New Zealand and India imports from New Zealand provides a strong foundation for the India-New Zealand FTA 2026, which is expected to boost trade volumes, improve market access, & create new opportunities for businesses on both sides.
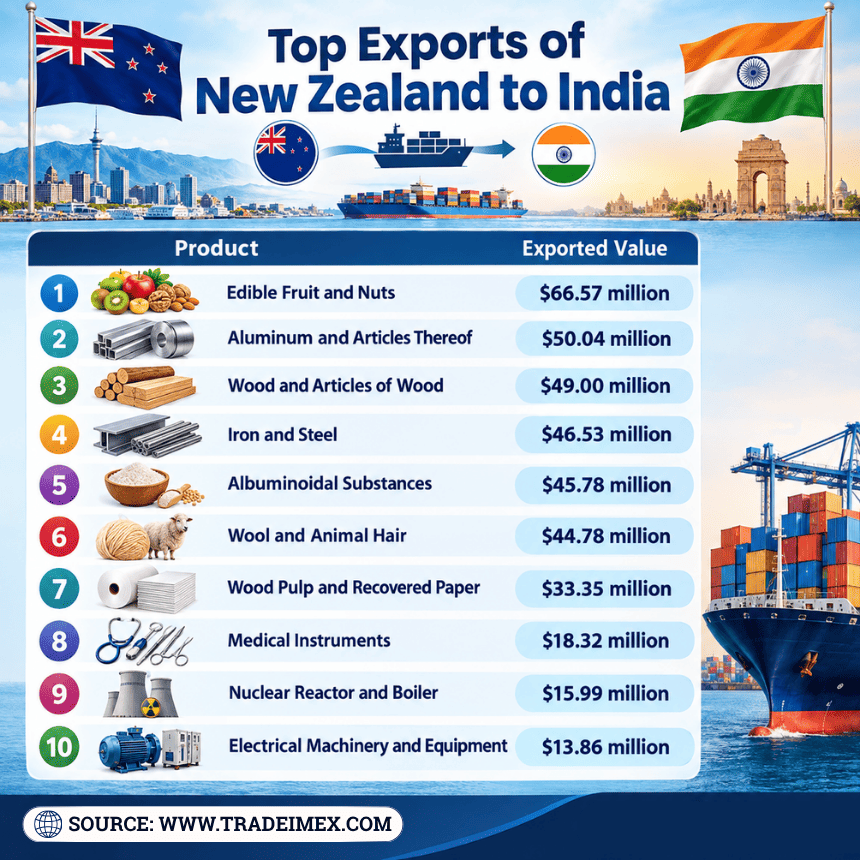
Top 10 Exports of New Zealand to India
Product | Exported Value |
Edible Fruit and Nuts | $66.57 million |
Aluminum and Articles Thereof | $50.04 million |
Wood and Articles of Wood | $49.00 million |
Iron and Steel | $46.53 million |
Albuminoidal Substances | $45.78 million |
Wool and Animal Hair | $44.78 million |
Wood Pulp and Recovered Paper | $33.35 million |
Medical Instruments | $18.32 million |
Nuclear Reactor and Boiler | $15.99 million |
Electrical Machinery and Equipment | $13.86 million |
Edible Fruit and Nuts (HS Code 08)
Total exports in 2025: $66.57 million
Growth in value: +$15.02 million
Growth rate: +29.1%
Share of total exports: 15.17%
This category remained New Zealand's largest export to India in 2025.
Aluminum and Articles Thereof (HS Code 76)
Total exports in 2025: $50.04 million
Growth in value: +$12.95 million
Growth rate: +34.9%
Share of total exports: 11.40%
Aluminum shipments continued to expand due to industrial demand.
Wood and Articles of Wood (HS Code 44)
Total exports in 2025: $49.00 million
Growth in value: +$2.68 million
Growth rate: +5.8%
Share of total exports: 11.16%
Wood products remain an important component of bilateral trade.
Iron and Steel (HS Code 72)
Total exports in 2025: $46.53 million
Decline in value: -$10.72 million
Decline rate: -18.7%
Share of total exports: 10.60%
Despite the decline, iron and steel remained among the top exports.
Albuminoidal Substances (HS Code 35)
Total exports in 2025: $45.78 million
Growth in value: +$13.87 million
Growth rate: +43.5%
Share of total exports: 10.43%
Demand from food processing and industrial sectors supported growth.
Wool and Animal Hair (HS Code 51)
Total exports in 2025: $44.78 million
Decline in value: -$2.00 million
Decline rate: -4.3%
Share of total exports: 10.20%
Wool remains one of New Zealand's traditional export strengths.
Wood Pulp and Recovered Paper (HS Code 47)
Total exports in 2025: $33.35 million
Growth in value: +$5.75 million
Growth rate: +20.8%
Share of total exports: 7.60%
Strong demand from paper and packaging industries drove exports.
Medical Instruments (HS Code 90)
Total exports in 2025: $18.32 million
Growth in value: +$1.75 million
Growth rate: +10.5%
Share of total exports: 4.17%
The segment reflects growing technology-driven trade.
Nuclear Reactor and Boiler (HS Code 84)
Total exports in 2025: $15.99 million
Growth in value: +$8.71 million
Growth rate: +119.5%
Share of total exports: 3.64%
This category recorded one of the strongest growth rates in 2025.
Electrical Machinery and Equipment (HS Code 85)
Total exports in 2025: $13.86 million
Growth in value: +$7.16 million
Growth rate: +106.8%
Share of total exports: 3.16%
Rising industrial modernization contributed to export growth.
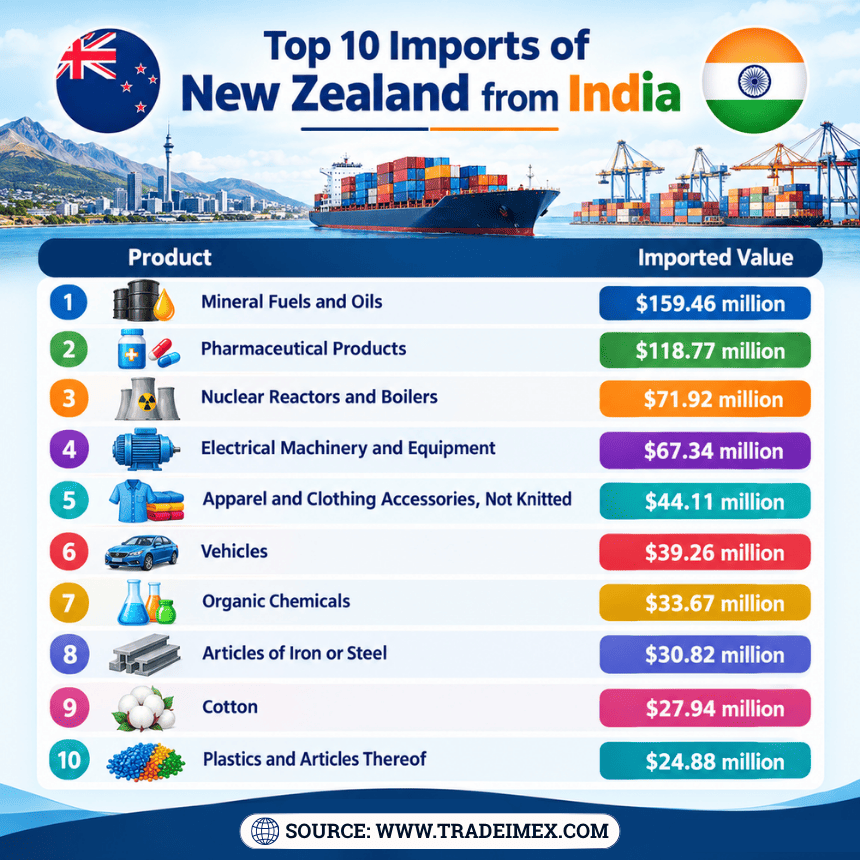
Top 10 Imports of New Zealand from India
Product | Imported Value |
Mineral Fuels and Oils | $159.46 million |
Pharmaceutical Products | $118.77 million |
Nuclear Reactors and Boilers | $71.92 million |
Electrical Machinery and Equipment | $67.34 million |
Apparel and Clothing Accessories, Not Knitted | $44.11 million |
Vehicles | $39.26 million |
Organic Chemicals | $33.67 million |
Articles of Iron or Steel | $30.82 million |
Cotton | $27.94 million |
Plastics and Articles Thereof | $24.88 million |
Mineral Fuels and Oils (HS Code 27)
Total imports in 2025: $159.46 million
Growth in value: +$55.63 million
Growth rate: +53.6%
Share of total imports: 18.13%
Mineral fuels remained the largest category in exports to New Zealand, reflecting strong demand for energy-related products.
Pharmaceutical Products (HS Code 30)
Total imports in 2025: $118.77 million
Growth in value: +$9.94 million
Growth rate: +9.1%
Share of total imports: 13.51%
India continued to strengthen its position as a major pharmaceutical supplier to New Zealand.
Nuclear Reactors and Boilers (HS Code 84)
Total imports in 2025: $71.92 million
Growth in value: +$13.45 million
Growth rate: +23.0%
Share of total imports: 8.18%
Machinery imports benefited from growing industrial and infrastructure requirements.
Electrical Machinery and Equipment (HS Code 85)
Total imports in 2025: $67.34 million
Growth in value: +$14.51 million
Growth rate: +27.5%
Share of total imports: 7.66%
Rising demand for electronics and electrical equipment supported strong growth.
Apparel and Clothing Accessories, Not Knitted (HS Code 62)
Total imports in 2025: $44.11 million
Growth in value: +$4.52 million
Growth rate: +11.4%
Share of total imports: 5.02%
India's garment industry maintained a solid presence in the New Zealand market.
Vehicles (HS Code 87)
Total imports in 2025: $39.26 million
Growth in value: +$8.44 million
Growth rate: +27.4%
Share of total imports: 4.46%
Automotive exports grew notably during the year.
Organic Chemicals (HS Code 29)
Total imports in 2025: $33.67 million
Growth in value: +$2.89 million
Growth rate: +9.4%
Share of total imports: 3.83%
Organic chemicals remained an important industrial input imported from India.
Articles of Iron or Steel (HS Code 73)
Total imports in 2025: $30.82 million
Growth in value: +$5.14 million
Growth rate: +20.0%
Share of total imports: 3.50%
Demand from construction and manufacturing sectors supported import growth.
Cotton (HS Code 52)
Total imports in 2025: $27.94 million
Growth in value: +$3.71 million
Growth rate: +15.3%
Share of total imports: 3.18%
Cotton products continued to contribute significantly to bilateral textile trade.
Plastics and Articles Thereof (HS Code 39)
Total imports in 2025: $24.88 million
Growth in value: +$2.96 million
Growth rate: +13.5%
Share of total imports: 2.83%
Plastic products maintained steady growth due to diversified industrial applications.
What Does the New Zealand-India FTA Mean?
The New Zealand-India trade agreement aims to strengthen economic cooperation by reducing trade barriers, improving market access, and facilitating investment and services trade. The India-New Zealand FTA 2026 is expected to create new opportunities for businesses in sectors such as agriculture, food products, machinery, pharmaceuticals, textiles, technology, and renewable energy. By enhancing trade efficiency and commercial partnerships, the India-New Zealand FTA could boost bilateral trade volumes and support long-term growth. The agreement also reflects the commitment of both countries to expanding economic ties and strengthening India-New Zealand bilateral relations.
Conclusion
The finalization of the India-New Zealand FTA finalized process represents an important step forward for economic cooperation between the two countries. Supported by growing trade volumes, expanding business ties, and complementary economic strengths, the India-New Zealand free trade agreement has the potential to unlock new opportunities for exporters, importers, investors, and service providers.
Trade data already shows a positive trajectory, with total bilateral merchandise trade reaching approximately $1.32 billion in 2025. Strong growth in sectors such as fruits, aluminum, wood products, industrial inputs, machinery, and technology-related goods highlights the broadening scope of the relationship. As the India-New Zealand trade deal progresses, businesses can expect improved market access, reduced trade barriers, and stronger commercial collaboration. These developments are likely to reinforce India-New Zealand bilateral relations and contribute to sustained trade growth in the years ahead.
Note For Our Readers
We hope that you liked our data-driven and interactive blog report on the recently finalized India-New Zealand free trade agreement. For the latest New Zealand import-export data, or to search live data by country or HS code, contact TradeImeX at info@tradeimex.in and get customized trade reports, AI-driven trade research, & market insights for your business.
Frequently Asked Questions
What is the India-New Zealand FTA?
The India-New Zealand free trade agreement is a trade pact designed to improve market access and reduce trade barriers between the two countries.
How does the FTA support businesses?
It can reduce tariffs, simplify customs procedures, and improve market access.
What is the future outlook for India-New Zealand trade?
The outlook remains positive due to growing trade volumes, economic cooperation, and expected FTA benefits.
What sectors could benefit from the FTA?
Agriculture, food processing, pharmaceuticals, machinery, textiles, technology, education, and services could benefit.
What are the major New Zealand exports to India?
Key exports include edible fruits, aluminum, wood products, iron and steel, wool, and industrial inputs.
Explore the latest global trade trends, market insights, import-export analysis, and industry updates with TradeImeX blogs.
Request a Data Sample →
Tradeimex
TradeImeX’s content team brings together expertise in global trade data, import-export trends, market intelligence, and international business. Our writers turn complex trade data into clear, actionable insights to help businesses understand markets, identify opportunities, and make informed decisions. From emerging trade trends to country and product-level analysis, we focus on delivering timely insights backed by reliable data.