

Indonesia is one of Southeast Asia’s largest import markets, supported by its expanding manufacturing sector, infrastructure development, consumer demand, energy needs, and growing industrial production. The country imports a broad range of machinery, electrical equipment, vehicles, plastics, metals, chemicals, cereals, fuels, and other intermediate and capital goods. According to the latest Indonesia import data and Indonesia customs data, the total value of Indonesia imports reached $241.85 billion in 2025, a 4% increase from the previous year. Indonesia imported goods worth $163.32 billion in the first seven months of 2026.
According to global trade data, Indonesia is the 28th-largest importer in the world. Indonesian imports included $32.74 billion of oil & gas and $208.63 billion of non-oil and gas products, according to the import data of Indonesia. Raw materials & auxiliary goods accounted for the largest share of Indonesia's imports, highlighting the country's dependence on imported inputs for manufacturing and industrial activity. The import market continued to expand in 2026. During January-August 2026, Indonesia imported around $186.39 billion, up 19.84% from $155.54 billion during the same period of 2025. Non-oil and gas imports increased even faster, rising 16.83% to $157.09 billion.
Indonesia Import Data 2025-26: Key Statistics
Indonesia imports 2025: $241.85 billion
Import growth: 4% year-on-year
Oil & gas imports: $32.74 billion
Non-oil & gas imports: $208.63 billion
Raw materials & auxiliary goods: $169.22 billion
Capital goods: $49.72 billion
Consumer goods: $22.42 billion
January-August 2026 imports: $186.39 billion
January-August 2026 growth: 19.84%
Largest import source: China
China's 2025 import share: about 36.2%
Indonesia Import Data 2025: Imports Reach $241.85 Billion
Indonesia's import market maintained positive growth in 2025 after reaching $235.20 billion in 2024. Total imports increased to $241.85 billion, representing a year-on-year increase of 4%. The structure of Indonesia's imports demonstrates that the country primarily imports products required for industrial production rather than relying predominantly on finished consumer products, according to BPS Statistics Indonesia.
Raw materials and auxiliary goods represented the largest import category at $169.22 billion, accounting for 70.11% of total imports. Capital goods followed at $49.72 billion, representing 20.60%, while consumer goods accounted for $22.42 billion, or 9.29%. This import structure is important for understanding Indonesia's manufacturing economy. The dominance of raw materials and intermediate inputs indicates that international suppliers play a significant role in Indonesia's industrial supply chains.
Indonesia Imports by Economic Category, 2025
Raw materials & auxiliary goods: $169.22 billion (70.11%)
Capital goods: $49.72 billion (20.60%)
Consumer goods: $22.42 billion (9.29%)
Total imports: $241.85 billion
The capital-goods segment was particularly strong. Capital goods imports increased 19.08% in 2025 compared with 2024, reaching $49.72 billion. This points to continued investment in machinery, production equipment, infrastructure, and industrial capacity.
Indonesia Imports by Country: Where Does Indonesia Import Goods From?
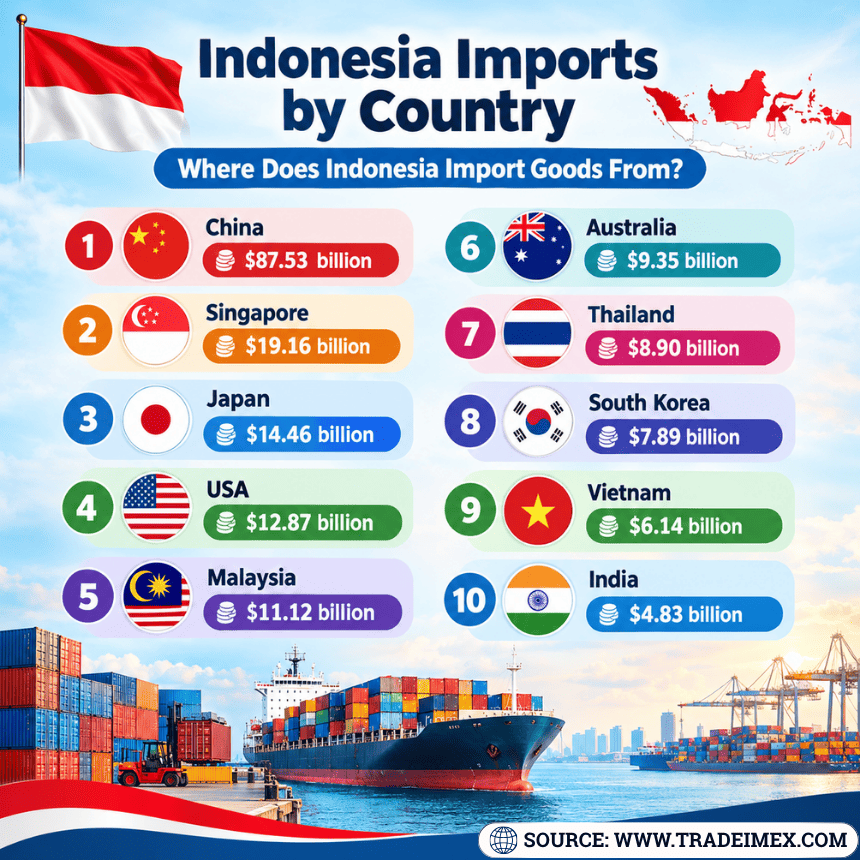
Indonesia's imports come from a diversified range of countries, reflecting the nation's extensive trading network. Some of the primary countries from which Indonesia imports goods include China, Japan, and Singapore. These countries, among others, contribute to Indonesia's import landscape, shaping the nation's economy and trade relationships. China stands out as a significant source of imports for Indonesia due to its vast manufacturing capacity and trade relations, as per the data on Indonesia imports from China. The top 10 import partners of Indonesia, as per the data on Indonesia imports by country and shipment data for 2025, include:
1. China: $87.53 billion (36.2%)
2. Singapore: $19.16 billion (7.9%)
3. Japan: $14.46 billion (6%)
4. USA: $12.87 billion (5.3%)
5. Malaysia: $11.12 billion (4.6%)
6. Australia: $9.35 billion (3.9%)
7. Thailand: $8.90 billion (3.7%)
8. South Korea: $7.89 billion (3.3%)
9. Vietnam: $6.14 billion (2.5%)
10. India: $4.83 billion (2%)
Together, these major suppliers represent a substantial portion of Indonesia's import market. Asia is particularly important: BPS data shows that imports from Asia reached $180.39 billion in 2025 according to the Asia trade data, while imports from ASEAN amounted to $47.69 billion.
China's dominance is especially significant. Indonesia's imports from China were around $87.4 billion, according to BPS, equivalent to 36.22% of total imports. Singapore's position is also strategically important because of its role as a regional trading and refining hub. Indonesia imported around $19.06 billion from Singapore in 2025, while Japan supplied around $14.46 billion.
Indonesia Major Imports: What Are the Top 10 Imports of Indonesia
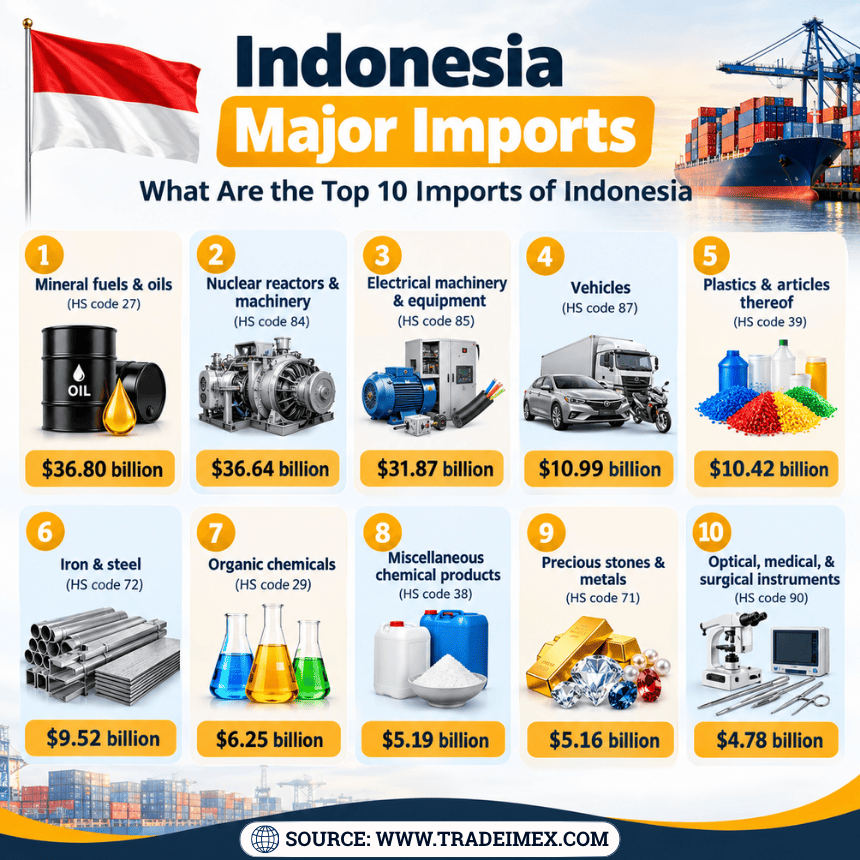
Indonesia's major imports encompass a diverse range of goods that play a pivotal role in its economy. The top 10 imports of Indonesia include machinery and electrical equipment, mineral fuels, chemicals, plastics, and vehicles. Additionally, iron and steel, optical and medical instruments, dairy products, cereals, and pharmaceuticals are significant imports for the country. These imports reflect Indonesia's reliance on foreign markets to meet the demands of its growing population and expanding industries. The top 10 main imports of Indonesia in 2025-26, as per Indonesia’s Ministry of Trade data, include:
1. Mineral fuels & oils (HS code 27): $36.80 billion (15.2%)
2. Nuclear reactors & machinery (HS code 84): $36.64 billion (15.1%)
3. Electrical machinery & equipment (HS code 85): $31.87 billion (13.1%)
4. Vehicles (HS code 87): $10.99 billion (4.5%)
5. Plastics & articles thereof (HS code 39): $10.42 billion (4.3%)
6. Iron & steel (HS code 72): $9.52 billion (3.9%)
7. Organic chemicals (HS code 29): $6.25 billion (2.5%)
8. Miscellaneous chemical products (HS code 38): $5.19 billion (2.1%)
9. Precious stones & metals (HS code 71): $5.16 billion (2.1%)
10. Optical, medical, & surgical instruments (HS code 90): $4.78 billion (1.9%)
Indonesia Import Data 2026: Imports Accelerate
Indonesia's import growth became considerably stronger in 2026. During January-August 2026, Indonesia imported $186.39 billion, compared with $155.54 billion during January-August 2025. This represents an increase of 19.84%. Non-oil and gas imports rose from $134.46 billion to $157.09 billion, an increase of 16.83%.
Monthly data also shows that import demand remained substantial throughout the year. Imports reached $21.20 billion in January, $20.89 billion in February, $19.21 billion in March, $25.21 billion in April, $24.81 billion in May, $25.91 billion in June and $26.09 billion in July. In August 2026, Indonesian imports reached around $23.06 billion, up 19.09% year-on-year, according to Reuters reporting based on official data.
Indonesia Imports January-August 2026
January: $21.20 billion
February: $20.89 billion
March: $19.21 billion
April: $25.21 billion
May: $24.81 billion
June: $25.91 billion
July: $26.09 billion
August: $23.06 billion
Total Jan-Aug 2026: $186.39 billion
The strong 2026 performance suggests that Indonesia's demand for imported machinery, electrical equipment, industrial inputs, fuels, chemicals, & other products remained robust.
Indonesia Import Data: Last 10 Years Import Performance
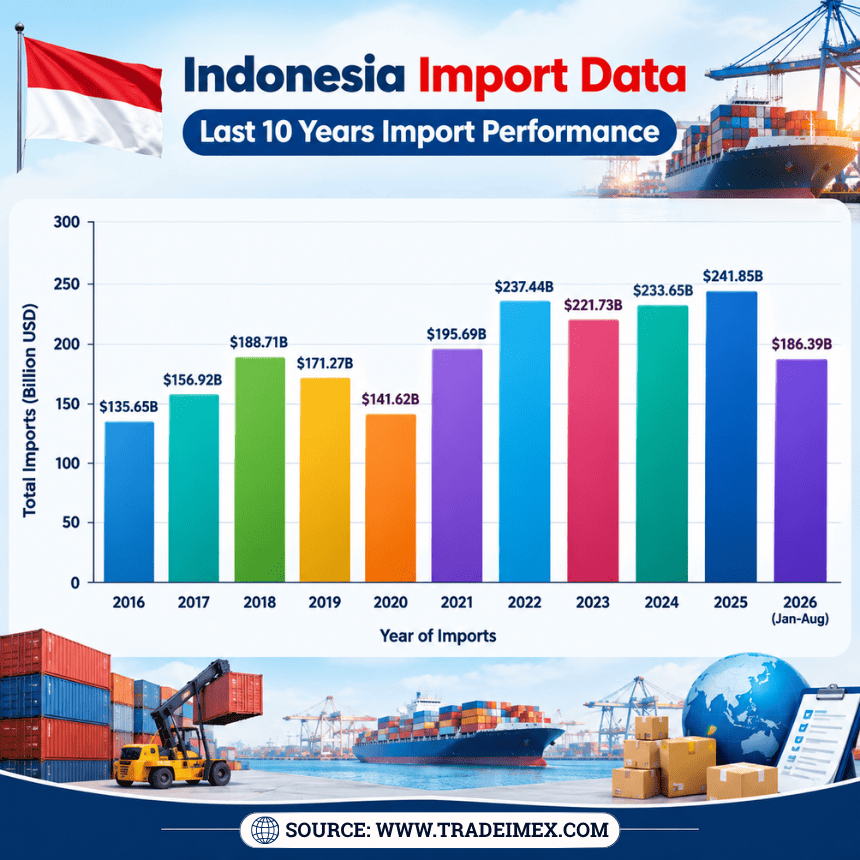
Year of Imports | Indonesia’s Total Imports ($) |
2016 | $135.65 billion |
2017 | $156.92 billion |
2018 | $188.71 billion |
2019 | $171.27 billion |
2020 | $141.62 billion |
2021 | $195.69 billion |
2022 | $237.44 billion |
2023 | $221.73 billion |
2024 | $233.65 billion |
2025 | $241.85 billion |
2026 (January-August) | $186.39 billion |
Why China Dominates Indonesia Imports
China's leading position in Indonesia's import market is closely connected with its ability to supply machinery, electrical equipment, manufactured components, industrial products, chemicals and consumer goods. During January-June 2025, China supplied around $40 billion of Indonesia's non-oil & gas imports, representing 39.97% of non-oil & gas imports during that period, as per the data on Indonesia-China trade relations.
Machinery and mechanical equipment, electrical machinery and equipment, & vehicles and parts were among the important product groups supplied from China. This makes China particularly important for Indonesian manufacturers and distributors looking for machinery, components, electronics, industrial materials and finished products.
Indonesia's Top Individual Imported Products
Looking below the HS-2 category level provides another perspective on Indonesia's import demand. Among individual HS-6 products reported by Indonesia's Ministry of Trade, unwrought non-monetary gold was worth around $4.88 billion in 2025, while wheat and meslin imports reached $3.28 billion. Smartphone imports under HS 851713 reached around $2.98 billion, increasing 53.20% from 2024.
Selected Major Individual Import Products in 2025
Unwrought non-monetary gold (HS 710812): $4.88 billion
Wheat and meslin (HS 100199): $3.28 billion
Smartphones (HS 851713): $2.98 billion
The rapid growth in smartphone imports is particularly notable, with the value more than 50% higher than in 2024, according to Indonesia smartphone import data.
Indonesia's Import Market: What the Data Shows
The latest Indonesia import data for 2025-26 reveals several important trends.
Indonesia's import market is strongly industrial in nature. More than 70% of imports in 2025 consisted of raw materials & auxiliary goods, while capital goods accounted for another 20.60%.
China is overwhelmingly important as a sourcing market. With more than $87 billion in imports, China alone supplied around 36% of Indonesia's total imports in 2025.
Machinery and electrical equipment together represented around $68.52 billion of non-oil and gas imports in 2025.
Import growth accelerated substantially in 2026. Indonesia's imports increased nearly 20% during January-August 2026, indicating stronger demand for foreign products & industrial inputs.
Indonesia Import Data by Port
Indonesia's import activity is concentrated through major ports, with Tanjung Priok remaining the country's most important import unloading point.
In 2025, Tanjung Priok handled imports worth around $91.79 billion, representing 38.03% of Indonesia's total import value.
Jakarta Province also remained the primary unloading location in individual monthly statistics.
In December 2025, imports discharged through Jakarta Province were valued at around $11.88 billion, equivalent to 49.84% of that month's imports.
For companies analyzing Indonesia import opportunities, port-level data can therefore be as important as country and product-level information.
Indonesia Import Market Outlook 2026
Indonesia's import outlook remains closely linked to industrial production, infrastructure investment, domestic consumption and manufacturing demand.
The strong growth recorded during January-August 2026 suggests that import activity is considerably stronger than the relatively modest 4% growth recorded for full-year 2025.
Machinery imports increased 15.26% during January-August 2026, while electrical machinery imports grew 22.94%.
Plastics increased 20.70%, iron and steel rose 16.04%, and miscellaneous chemical products increased 24.59%.
Vehicle and parts imports declined 7.49% during the first eight months of 2026, while precious metals and stones declined 14.72%.
This divergence shows why broad country-level import statistics alone are not enough for businesses. Product-specific and HS-code-level analysis is essential for identifying where demand is actually expanding.
Indonesia Import Data for Business & Market Research
For importers, exporters, manufacturers, sourcing companies and market researchers, Indonesia import data can provide much deeper insights than total trade values. Trade data can be analyzed by:
Importer and buyer
Supplier/exporter
Product and HS code
Country of origin
Port of discharge
Shipment value
Shipment quantity
Import frequency
Historical import trends
Product descriptions
Supplier-buyer relationships
For example, a company interested in selling machinery to Indonesia can use HS Code 84 import data to identify major Indonesian buyers, their sourcing countries, shipment frequency and suppliers. Similarly, businesses in electronics can analyze HS Code 85 imports to identify active buyers and changing supplier relationships.
TradeImeX provides access to Indonesia import data, including company-level and product-level trade intelligence, enabling businesses to identify buyers, suppliers, products, HS codes, shipment trends and potential market opportunities.
Key Takeaways: Indonesia Import Data 2025-26
Indonesia imports 2025: $241.85 billion
2025 import growth: 4%
Non-oil & gas imports: $208.63 billion
Largest import source: China
China's imports: around $87.5 billion
Largest non-oil import category: Machinery & mechanical appliances (HS code 84)
HS 84 imports: $36.64 billion
HS 85 imports: $31.88 billion
January-August 2026 imports: $186.39 billion
Jan-Aug 2026 growth: 19.84%
Largest import port: Tanjung Priok
Tanjung Priok imports: $91.79 billion in 2025
Conclusion
Indonesia's import market reached $241.85 billion in 2025, with raw materials and auxiliary goods accounting for the majority of imports. China remained the country's dominant import partner, supplying around $87.5 billion of goods, while Singapore, Japan, the United States, the European Union, Malaysia, Australia, Thailand, South Korea and Vietnam were also major suppliers. The country's import basket is dominated by machinery, electrical equipment, vehicles, plastics, iron and steel, chemicals & other industrial products. Machinery & electrical equipment alone accounted for more than $68 billion of non-oil and gas imports in 2025.
The picture became even stronger in 2026. Indonesia imported $186.39 billion during January-August 2026, up 19.84% from the corresponding period of 2025. Rising imports of machinery, electrical equipment, plastics, steel and chemical products point to continued demand across Indonesia's industrial and manufacturing sectors.
Note For Our Readers
For companies seeking to enter the Indonesian market, the opportunity extends beyond knowing what Indonesia imports. The real advantage comes from identifying which Indonesian companies are importing those products, where they source them from, how frequently they import, what quantities they purchase & which suppliers currently serve them. With detailed Indonesia export-import data, businesses can move from broad market research to actionable buyer, supplier, product, and HS code intelligence with AI-powered trade search. Contact TradeImeX at info@tradeimex.in to get customized Indonesia trade reports and market insights for your business.
Explore the latest global trade trends, market insights, import-export analysis, and industry updates with TradeImeX blogs.
Request a Data Sample →
Tradeimex
TradeImeX’s content team brings together expertise in global trade data, import-export trends, market intelligence, and international business. Our writers turn complex trade data into clear, actionable insights to help businesses understand markets, identify opportunities, and make informed decisions. From emerging trade trends to country and product-level analysis, we focus on delivering timely insights backed by reliable data.