

The global pharmaceutical industry remains one of the most important and resilient segments of international trade. According to the latest Pharmaceutical import data, the total value of global pharmaceutical imports reached $1.03 trillion, a 9% increase from the previous year. Global pharmaceutical exports accounted for a total value of $974.35 billion in 2025, a 12% increase from the previous year, according to the pharmaceutical export data. The total pharmaceutical trade turnover reached around $2 trillion in 2025, according to pharmaceutical industry trade data and global trade data under HS code 30.
From finished medicines & vaccines to pharmaceutical formulations, bulk drugs, & other preparations, the sector connects manufacturing hubs, research-driven economies, and healthcare markets worldwide. The latest pharmaceutical export-import data shows that global pharmaceutical demand reached $1.03 trillion in 2025. Pharmaceutical trade also became an important contributor to the expansion of global merchandise trade during the year, particularly as demand rose for medicines, pharmaceutical ingredients, and products linked to newer treatments.
Trade data for 2025 also highlights a highly concentrated global supply structure. European pharmaceutical manufacturing remains particularly important, with Germany, Switzerland, Ireland, Italy, Belgium, and France among the leading exporters. At the same time, the United States was by far the largest national importer of pharmaceutical products. For companies, investors, pharmaceutical manufacturers, distributors, and sourcing professionals, pharmaceutical industry trade data provides valuable insights into market demand, export opportunities, sourcing dependencies, product trends, and international competition.
Global Pharmaceutical Trade Overview
Pharmaceutical products are primarily classified under HS Code 30, which includes a broad range of medicines, pharmaceutical preparations, vaccines, blood products, and related products. Global pharmaceutical demand has expanded at a 7.3% CAGR over the past decade, demonstrating the sector's long-term expansion. The largest pharmaceutical category was HS code 3004, covering retail medicaments & formulated drugs. This segment alone accounted for around $571.5 billion of global imports in 2025, representing 55.6% of global pharmaceutical demand. Europe leads the global pharmaceutical market, according to the Europe trade data.
The second major segment was HS 3002, covering blood products, vaccines, and immunological products, with global imports of around $390.2 billion and a 38.0% share of pharmaceutical demand. Other pharmaceutical categories were considerably smaller:
- HS 3003 – Bulk mixed medicaments: $24.7 billion
- HS 3006 – Other pharmaceutical preparations: $26.1 billion
- HS 3005 – Medical dressings and bandages: $11.7 billion
- HS 3001 – Organo-therapeutic substances and extracts: $3.1 billion
These figures demonstrate that global pharmaceutical trade is dominated by finished and formulated medicines, vaccines, immunological products, and other high-value pharmaceutical preparations.
Pharmaceutical Imports by Country: Top Pharmaceutical Importing Countries
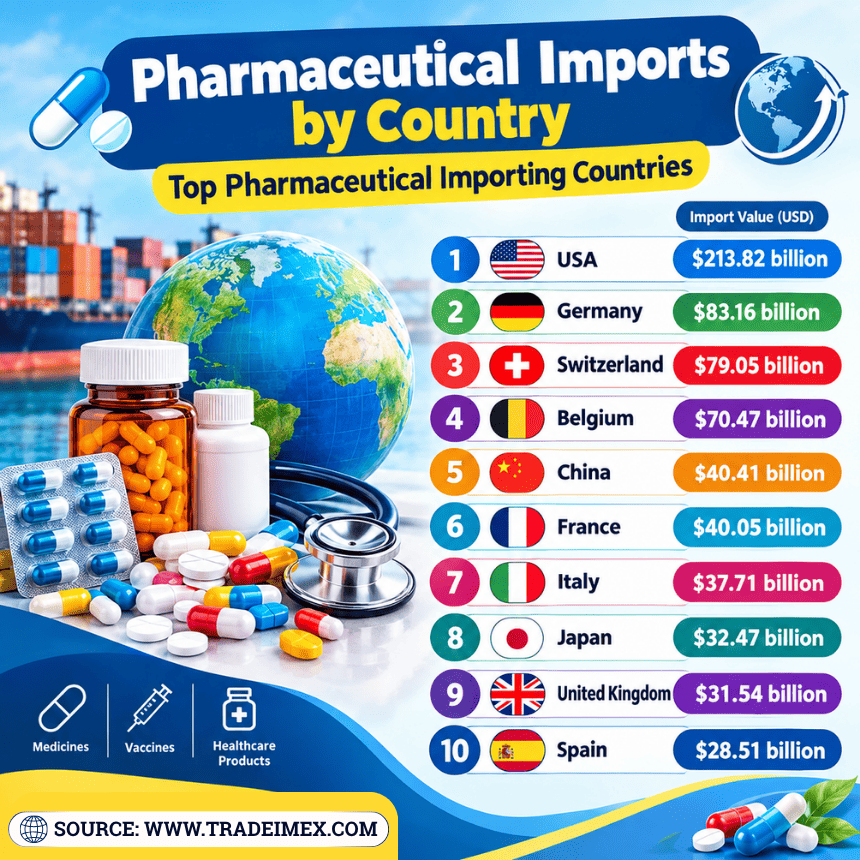
Pharmaceutical imports by country play a crucial role in meeting the healthcare needs of nations worldwide. The top pharmaceutical importing countries, such as the United States, Germany, and Japan, demonstrate a significant reliance on imported medications to maintain their healthcare infrastructure. These imports not only supplement domestic pharmaceutical production but also ensure a diverse range of medications are available to address the healthcare requirements of their populations. The top 10 pharmaceutical importer countries in 2025 include:
- USA: $213.82 billion (20.9%)
- Germany: $83.16 billion (8.1%)
- Switzerland: $79.05 billion (7.7%)
- Belgium: $70.47 billion (6.9%)
- China: $40.41 billion (3.9%)
- France: $40.05 billion (3.9%)
- Italy: $37.71 billion (3.7%)
- Japan: $32.47 billion (3.2%)
- United Kingdom: $31.54 billion (3.1%)
- Spain: $28.51 billion (2.8%)
Pharmaceutical Exports by Country: Top Pharmaceutical Exporting Countries
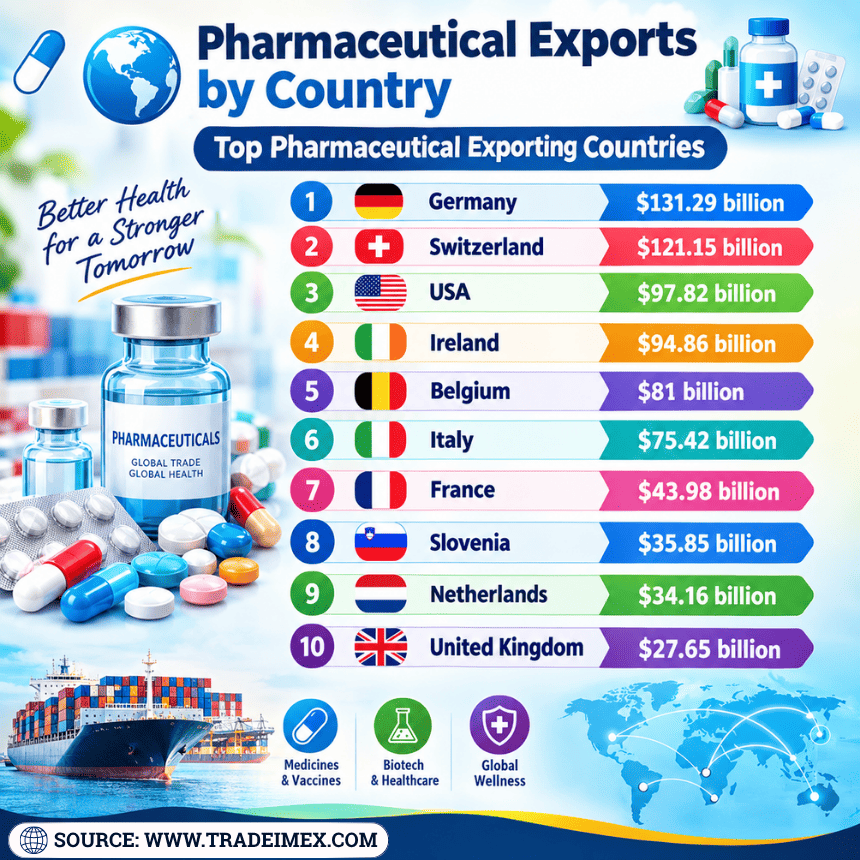
In a global landscape where pharmaceutical exports play a significant role in the economy, it's crucial to look at the top pharmaceutical exporting countries. Data on pharmaceutical exports by country highlights the key players driving this industry forward. From established pharmaceutical powerhouses like the United States and Germany to emerging contenders like Slovenia and the Netherlands, these countries play a vital role in shaping the global pharmaceutical market. Germany remains the largest exporter of pharmaceuticals, according to Germany pharmaceutical export data. The top 10 pharmaceutical exporters by country, as per the pharma export data for 2025, include:
- Germany: $131.29 billion (13.5%)
- Switzerland: $121.15 billion (12.4%)
- USA: $97.82 billion (10%)
- Ireland: $94.86 billion (9.7%)
- Belgium: $81 billion (8.3%)
- Italy: $75.42 billion (7.7%)
- France: $43.98 billion (4.5%)
- Slovenia: $35.85 billion (3.7%)
- Netherlands: $34.16 billion (3.5%)
- United Kingdom: $27.65 billion (2.8%)
Global Pharmaceutical Trade Data: Last 10 Years Trade Performance
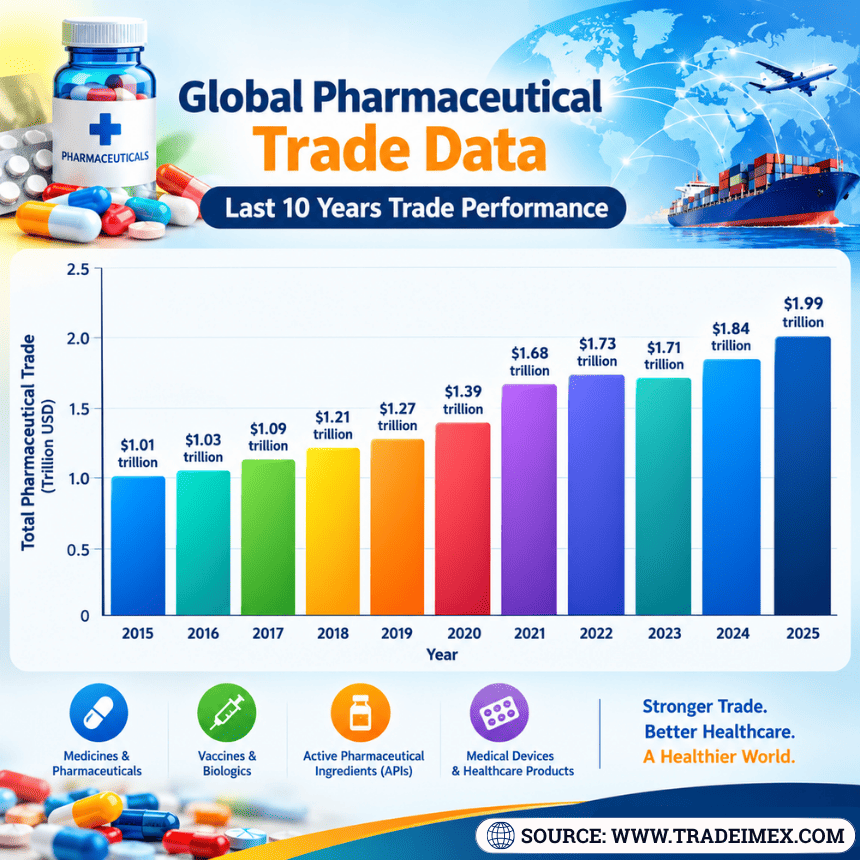
Year of Trade | Total Pharmaceutical Trade ($) |
2015 | $1.01 trillion |
2016 | $1.03 trillion |
2017 | $1.09 trillion |
2018 | $1.21 trillion |
2019 | $1.27 trillion |
2020 | $1.39 trillion |
2021 | $1.68 trillion |
2022 | $1.73 trillion |
2023 | $1.71 trillion |
2024 | $1.84 trillion |
2025 | $1.99 trillion |
US Pharmaceutical Trade Market
The United States occupies a particularly important position in global pharmaceutical trade because it is simultaneously a major producer, exporter, and importer, as per the US import-export data. In 2025, US pharmaceutical imports under HS 30 reached around $213.57 billion, making the country the largest national pharmaceutical importer in the world. The scale of US imports reflects several factors, including demand for innovative medicines, specialty pharmaceuticals, biologics, finished formulations, & pharma products manufactured through international supply chains. Along with imports, the USA is also the 3rd largest pharmaceutical exporter in the world, according to US pharmaceutical export data.
For exporters, the US market therefore remains an important destination to monitor. However, market entry is influenced not only by demand but also by regulatory approvals, product classification, intellectual-property considerations, manufacturing standards, and pharmaceutical compliance requirements.
Global Pharmaceutical Industry Market Size in 2025
The global pharmaceutical industry entered 2025 with strong underlying momentum. According to IQVIA's 2026 review, the global prescription medicine market reached around $1.7 trillion at list prices in 2025, representing 10% year-on-year growth. IQVIA also estimates that around 73 novel active substances were launched globally in 2025, above the average of the previous decade.
This market-size figure should be distinguished from international pharmaceutical trade data under HS 30. The pharmaceutical market measures medicine sales and use, while customs trade statistics measure cross-border merchandise flows. Consequently, the two figures are not directly interchangeable. For trade analysis, HS 30 pharmaceutical exports and imports provide a more specific view of international goods movement, while pharmaceutical market data captures the broader commercial value of medicines.
The market is also highly concentrated geographically. Data estimates that the United States accounted for 53% of the global pharmaceutical market in 2025, compared with 49% in 2021. Europe maintained around 24%, while the Asia-Pacific region accounted for around 11%. China remained the world's second-largest pharmaceutical market. The Middle East and Africa region recorded particularly strong growth, with the region expanding around 18% year-on-year in 2025.
Global Pharmaceutical Market: Key 2025 Figures
- Global prescription medicine market: around $1.7 trillion at list prices
- 2025 market growth: around 10% year-on-year
- US share of global pharmaceutical market: around 53%
- Europe's share: around 24%
- APAC share: around 11%
- Global novel active substances launched: around 73
- China: world's second-largest pharmaceutical market
- Middle East & Africa: around 18% year-on-year market growth in 2025
These figures show why pharmaceutical industry analysis cannot be limited to export and import values. Market consumption, new-drug launches, therapeutic innovation and healthcare expenditure all influence international trade flows.
Pharmaceutical Industry Growth Outlook 2026–2030
The outlook for the pharmaceutical industry remains positive despite pricing pressure, patent expiries, regulatory changes and geopolitical uncertainty. According to the Global Medicine Use Trends 2026 report, global medicine spending is expected to grow at around 5%–8% CAGR through 2030, with the global medicine market projected to reach around $2.6 trillion. The growth is expected to be driven primarily by innovative medicines in oncology, immunology, diabetes and obesity, while loss of exclusivity for major products will offset part of the growth.
The forecast also expects global medicine usage to approach 4 trillion defined daily doses by 2030. China is expected to remain one of the fastest-growing pharmaceutical markets, with medicine usage projected to reach an index of 196 by 2030 compared with a 2020 baseline of 100, effectively almost doubling usage over the decade. This expanding medicine consumption has direct implications for pharma import-export markets. Growing demand in emerging markets can create opportunities for manufacturers and exporters, while mature markets continue to generate demand for innovative and high-value therapies.
Top Pharmaceutical Therapy Areas in 2025
The structure of pharmaceutical demand is changing rapidly as new therapies gain adoption. In 2025, oncology, immunology and diabetes together accounted for around 43% of global pharmaceutical value. The obesity treatment market also moved into the top five global therapy areas.
Obesity was particularly important to pharmaceutical industry growth. Obesity medicines generated almost $31 billion in absolute year-on-year growth in 2025, making obesity the second-largest contributor to growth among therapy areas. Oncology, immunology, diabetes and obesity together generated around $111 billion of growth, equivalent to around 89% of the growth generated by the top 10 therapy areas.
This shift is significant for pharmaceutical trade data because high-growth therapies can change the composition of international shipments. Demand is increasingly moving toward biologics, injectable medicines, specialty medicines, oncology treatments & newer metabolic therapies rather than being driven exclusively by conventional small-molecule medicines.
Oncology Pharmaceutical Market
Cancer medicines remain one of the largest and most research-intensive areas of the pharmaceutical industry. Global Oncology Trends 2025 report estimated that global spending on oncology medicines reached $252 billion in 2024 and projected it to reach around $441 billion by 2029.
Oncology also represented around 41% of global clinical trials, while 2,162 oncology trials were started in 2024. This was 12% higher than the 2019 level and 58% higher than a decade earlier. The oncology market is also increasingly influenced by newer treatment modalities, including antibody-drug conjugates (ADCs), bispecific antibodies, and other targeted therapies. These products can command substantially higher commercial values and therefore influence both pharmaceutical market spending and high-value international trade.
Obesity and GLP-1 Medicines Reshape Pharmaceutical Demand
One of the most significant pharmaceutical market developments during 2025–26 has been the rapid expansion of medicines used to treat obesity and related metabolic conditions. Latest data identified obesity as one of the fastest-growing therapy areas in 2025, with nearly $31 billion in year-on-year absolute growth. The expansion of GLP-1-based therapies has also created new pharmaceutical manufacturing and supply-chain requirements. The market is increasingly moving from traditional oral treatments toward injectable and, more recently, oral versions of metabolic therapies.
The commercial importance of the segment is expected to continue rising. Reuters reported in September 2026 that the global weight-loss drug market is projected to reach around $100 billion in annual sales within the next decade, with major pharmaceutical companies expanding their pipelines and competing across injectable and oral treatments. For pharmaceutical trade researchers, this creates an important area to monitor through product-level customs data, pharmaceutical shipment records, and HS-code trends.
Pharmaceutical R&D Investment and Innovation
The expansion of the pharmaceutical market is closely connected with continued investment in research and development. The 2026 Global R&D Trends report found that biopharma R&D funding remained high in 2025, although both funding and large-pharma R&D expenditure slowed compared with 2024. Funding and dealmaking remained well above pre-pandemic levels, while deal activity between Chinese and international pharmaceutical companies reached an all-time high.
The pharmaceutical R&D ecosystem is also becoming increasingly international. Clinical trial activity is shifting across regions, emerging biopharma companies are playing a larger role, and artificial intelligence is being incorporated into drug discovery, clinical planning, development, and regulatory processes.
For comparison, previous R&D analysis reported that biopharma funding reached around $102 billion in 2024, excluding the unusually high pandemic-era funding of 2020–21. The number of clinical trial starts also reached 5,318 in 2024, broadly returning to the pre-pandemic 2019 level of 5,316.
New Pharmaceutical Drug Approvals in 2025–26
Drug approvals provide another important indicator of pharmaceutical industry innovation. The US FDA's Center for Drug Evaluation and Research approved 46 novel drugs in 2025. The FDA defines a novel drug as one that had not previously been approved or marketed in the United States.
For 2026, the FDA's novel-drug approval list had already reached 40 approvals by September 11, 2026, including treatments and products covering areas such as spinal muscular atrophy, breast cancer, pancreatic cancer, multiple myeloma, hypertension, HIV, and obesity.
These approvals demonstrate how quickly the pharmaceutical product mix can change. New medicines can create new categories of international demand, increase imports of active pharmaceutical ingredients and specialized formulations, and establish new export opportunities for manufacturers with the required regulatory approvals.
Biopharmaceutical M&A and Industry Consolidation
Pharmaceutical industry trade is also influenced by mergers, acquisitions, and licensing agreements. Trade data reported that global biopharma M&A activity rebounded strongly in 2025. Aggregate M&A deal value increased 133% from 2024 to around $133 billion, while the number of deals reached 50, the highest level since 2021. The average deal size was around $2.7 billion.
This consolidation is important because acquisitions can alter manufacturing networks, intellectual-property ownership, import arrangements, and export markets. A company acquiring a pharmaceutical business may also inherit manufacturing facilities and established distribution networks across multiple countries.
Pharmaceutical Industry Trade vs Pharmaceutical Market Size
It is important to separate three different measures when analyzing the global pharmaceutical industry:
- Pharmaceutical market size: Measures the commercial value of medicines sold or used in healthcare markets. The global prescription medicine market at around $1.7 trillion in 2025 at list prices.
- Pharmaceutical import-export trade: Measures cross-border movement of pharmaceutical products. Under HS 30, global pharmaceutical demand/imports were around $1.02 trillion in 2025.
- Pharmaceutical industry revenue: Measures company-level sales and revenue and can include different product categories, geographic reporting methods, and accounting treatments.
These measures should not be added together. Instead, they provide complementary views of the pharmaceutical economy.
Pharmaceutical Industry Outlook for 2026
The pharmaceutical industry enters the remainder of 2026 with several major growth drivers:
- Continued expansion of oncology medicines
- Rapid adoption of obesity and GLP-1 therapies
- Increasing demand for biologics and specialty medicines
- Growth in pharmaceutical consumption in China and other emerging markets
- Continued R&D investment and new-drug launches
- Greater use of artificial intelligence in drug discovery and development
- Increasing biopharma M&A and licensing activity
- Patent expiries and generic/biosimilar competition
- Greater attention to pharmaceutical supply-chain resilience
- Regulatory and pricing changes affecting major markets
The overall direction remains one of continued market expansion. Data forecasts 5%–8% annual growth through 2030, while global medicine usage is expected to approach 4 trillion defined daily doses by the end of the decade.
Final Pharmaceutical Industry Snapshot: 2025–26
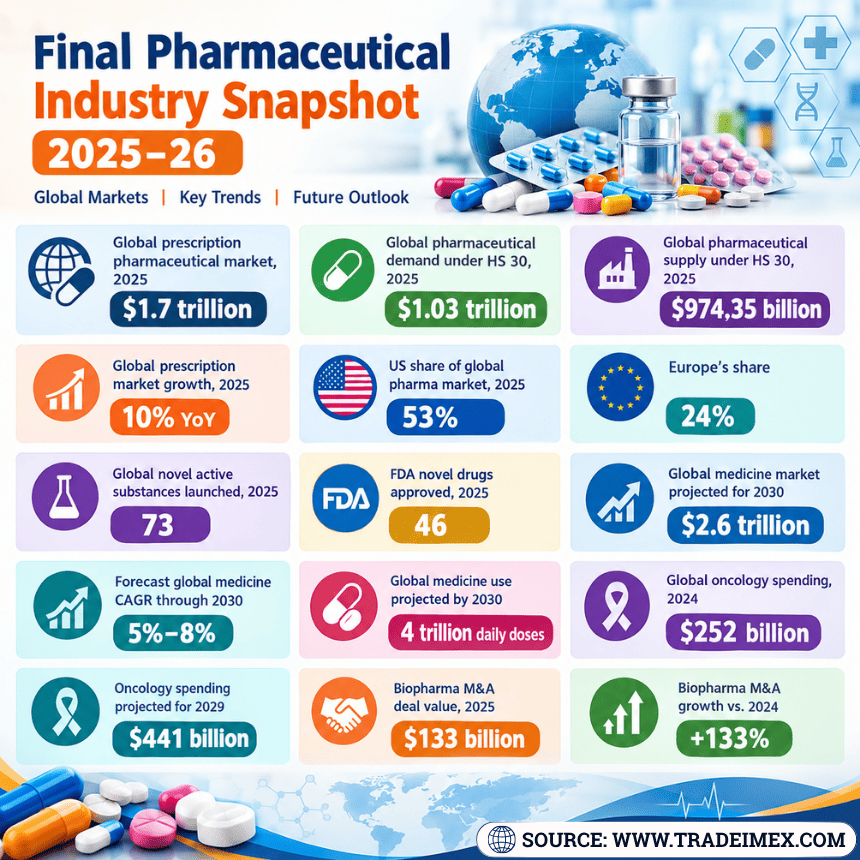
The latest pharmaceutical industry statistics present a picture of a $1.7 trillion global prescription medicine market, more than $1 trillion in international pharmaceutical demand under HS 30, strong innovation activity, and rapidly changing therapeutic priorities.
Indicator | Latest figure |
Global prescription pharmaceutical market, 2025 | $1.7 trillion |
Global pharmaceutical demand under HS 30, 2025 | $1.03 trillion |
Global pharmaceutical supply under HS 30, 2025 | $974.35 billion |
Global prescription market growth, 2025 | 10% YoY |
US share of global pharma market, 2025 | 53% |
Europe's share | 24% |
Global novel active substances launched, 2025 | 73 |
FDA novel drugs approved, 2025 | 46 |
Global medicine market projected for 2030 | $2.6 trillion |
Forecast global medicine CAGR through 2030 | 5%–8% |
Global medicine use projected by 2030 | 4 trillion daily doses |
Global oncology spending, 2024 | $252 billion |
Oncology spending projected for 2029 | $441 billion |
Biopharma M&A deal value, 2025 | $133 billion |
Biopharma M&A growth vs. 2024 | +133% |
Overall, the 2025–26 data shows that pharmaceutical trade is being driven by more than traditional medicine demand. High-growth therapy areas such as oncology, diabetes and obesity, continued innovation, biologics, specialty medicines, changing healthcare consumption patterns & increasingly interconnected manufacturing networks are all reshaping global pharmaceutical exports and imports.
For trade professionals, this makes pharmaceutical industry trade data increasingly valuable: it connects the broader $1.7 trillion pharmaceutical market with the actual cross-border movement of medicines and pharmaceutical products, helping businesses identify suppliers, buyers, high-growth markets, sourcing opportunities and changing international trade patterns.
Major Pharmaceutical Trade Trends in 2025
1. Pharmaceutical trade remained a major global growth driver
The World Trade Organization reported that medicines and pharmaceutical ingredients, particularly hormones used in treatments for conditions such as obesity and diabetes, were among the contributors to the increase in global merchandise trade value in 2025. This highlights the growing importance of high-value pharmaceutical ingredients and advanced medicines within international trade.
2. Finished formulations dominate pharmaceutical demand
HS 3004 accounted for more than half of global pharmaceutical demand in 2025. Its around $571.5 billion import value demonstrates the enormous international market for finished and formulated medicines.
3. Europe remains a major pharmaceutical export hub
Germany, Switzerland, Ireland, Italy, Belgium and France all ranked among the world's major pharmaceutical exporters in 2025. European countries also have highly interconnected manufacturing, research and distribution networks. Eurostat reported that EU exports of medicinal and pharmaceutical products increased by around €50 billion in 2025, while imports increased by €25 billion. The EU's pharmaceutical trade surplus consequently rose from €195 billion to €221 billion.
4. The US remains the largest pharmaceutical import market
With around $213.57 billion in pharmaceutical imports in 2025, the United States represented the world's largest national pharmaceutical import market.
This makes US pharmaceutical import data particularly relevant for exporters, manufacturers, distributors, and market-entry researchers.
5. India continues to expand its global pharmaceutical footprint
India's around $25.8 billion in HS 30 exports in 2025 and around $31.12 billion in broader drugs-and-pharmaceuticals exports during FY 2025-26 demonstrate the importance of the Indian pharmaceutical industry to international trade.
Pharmaceutical Trade Data by HS Code
Analyzing pharmaceutical exports and imports only at the country level can hide important product-level differences. HS-code analysis provides a more detailed view of what is actually being traded.
The major HS 30 categories include:
- HS 3001: Organo-therapeutic substances and extracts
- HS 3002: Blood products, vaccines, toxins, cultures and immunological products
- HS 3003: Medicaments not in measured doses or retail packaging
- HS 3004: Medicaments in measured doses or retail packaging
- HS 3005: Wadding, gauze, bandages and similar pharmaceutical products
- HS 3006: Other pharmaceutical goods and preparations
Among these, HS 3004 and HS 3002 dominate global trade by value. Therefore, companies researching pharmaceutical markets should examine individual HS codes rather than relying only on total pharmaceutical trade figures.
What Pharmaceutical Import-Export Data Reveals for Businesses
Detailed pharmaceutical trade data can provide more than a simple measurement of exports and imports. Companies can use pharmaceutical shipment and customs data to analyze:
- Market demand: Identify countries importing increasing quantities or values of specific pharmaceutical products.
- Buyer discovery: Find companies actively importing particular pharmaceutical products or HS codes.
- Supplier analysis: Identify exporters supplying specific medicines, pharmaceutical ingredients, and formulations.
- Competitor research: Compare export markets, shipment activity & product categories used by competing pharmaceutical companies.
- Market diversification: Identify alternative destination markets when a company is overly dependent on a single export market.
- Sourcing intelligence: Determine where pharmaceutical products and ingredients are being sourced and identify potential international suppliers.
- HS-code intelligence: Track trade flows at the product classification level to understand specific categories rather than treating pharmaceuticals as one broad industry.
Pharmaceutical Export-Import Data: Outlook
The latest data indicates that pharmaceutical trade is entering a period in which product innovation, healthcare demand, demographic changes, and international supply-chain strategies will continue to influence trade flows. The 2025 data already demonstrates the scale of this market: global pharmaceutical demand exceeded $1 trillion, while major exporters such as Germany, Switzerland, the United States, and Ireland continued to dominate international pharmaceutical supply.
At the same time, the United States remained the largest national import market, while India maintained a significant pharmaceutical trade surplus. For pharmaceutical companies, the next stage of trade intelligence will increasingly involve going beyond headline export and import values. Product-level HS-code data, destination markets, source countries, buyers, suppliers, shipment activity, and historical trade patterns can provide a more detailed picture of where pharmaceutical opportunities are developing.
Conclusion: Where is the Global Pharma Industry Heading?
The latest pharmaceutical export-import data confirms the pharmaceutical industry's central role in global trade. Global pharmaceutical demand reached around $1.03 trillion in 2025, with formulated medicines and immunological products accounting for the largest portions of international demand. Germany, Switzerland, the United States, Ireland, and Italy were among the leading individual pharmaceutical exporters, while the United States, Germany, Switzerland, Belgium, and China were among the largest pharmaceutical import markets.
Our Readers’ Note
For businesses, manufacturers, exporters, importers, distributors, and market researchers, pharmaceutical trade data provides a deeper view of the global pharma industry beyond headline market-size figures. TradeImeX helps users search pharmaceutical import-export data by country, HS code, product, buyer, supplier, shipment, and trade value to identify market opportunities and understand changing global pharmaceutical supply chains. Contact info@tradeimex.inand get customized trade reports, AI-driven trade research & market insights for your business.
Frequently Asked Questions
1. What is the global pharmaceutical market size in 2025?
The global prescription pharmaceutical market reached around $1.7 trillion in 2025 at list prices, according to trade data. This is different from global pharmaceutical merchandise trade, which measures cross-border shipments of pharmaceutical products.
2. How much was global pharmaceutical trade worth in 2025?
Global pharmaceutical demand/imports under HS Code 30 reached around $1.03 trillion in 2025. HS 3004, covering medicaments in measured doses or retail packaging, accounted for the largest share.
3. Which countries are the largest pharmaceutical exporters?
Germany, Switzerland, the United States, Ireland, and Italy were among the leading individual pharmaceutical exporters in 2025. Their positions reflect substantial manufacturing capacity, pharmaceutical research, high-value medicines, and integration into international supply chains.
4. Which country imported the most pharmaceutical products in 2025?
The United States was the largest national importer of pharmaceutical products in 2025, with imports of around $213 billion under HS Code 30. Germany, Switzerland, Belgium, and China were also among the major pharmaceutical import markets.
5. How can pharmaceutical trade data help businesses?
Pharmaceutical trade data can help businesses identify major importing markets, active buyers and suppliers, product-level demand, HS-code trends, sourcing countries, export destinations, and shipment patterns. This information can support market research, competitor analysis, supplier discovery and international expansion strategies.
Explore the latest global trade trends, market insights, import-export analysis, and industry updates with TradeImeX blogs.
Request a Data Sample →
Tradeimex
TradeImeX’s content team brings together expertise in global trade data, import-export trends, market intelligence, and international business. Our writers turn complex trade data into clear, actionable insights to help businesses understand markets, identify opportunities, and make informed decisions. From emerging trade trends to country and product-level analysis, we focus on delivering timely insights backed by reliable data.